


-
- Trading Platforms
- PU Prime App
- MetaTrader 5
- MetaTrader 4
- PU Copy Trading
- Web Trader
- PU Social
-
- Trading Conditions
- Account Types
- Spreads, Costs & Swaps
- Deposits & Withdrawals
- Fee & Charges
- Trading Hours


EN
2 November 2023,05:24
Daily Market Analysis
2 November 2023, 05:24

In a highly anticipated move, the Federal Reserve opted for a pause in its interest rate trajectory, aligning with market predictions. Federal Reserve Chair Jerome Powell, while announcing the decision, left the door ajar for potential future rate hikes, emphasising the central bank’s flexibility. Encouraged by this dovish stance, equity markets surged, a sentiment echoed in Asian markets as they opened on a positive note. Eyes now turn to the Bank of England, with expectations rife that it will follow suit with a rate pause. The prevailing lacklustre economic performance in the UK provides little impetus for a further hike, according to market consensus.
Current rate hike bets on 1st November Fed interest rate decision:
Source: CME Fedwatch Tool
0 bps (98.0%) VS 25 bps (2%)


Following a two-day policy meeting, Federal Reserve Chair Jerome Powell addressed the press, emphasising that maintaining the current range of the Fed’s benchmark overnight interest rate at 5.25%-5.50% was the prudent course of action amid prevailing economic uncertainties. He stressed that future monetary decisions remain data-dependent, with a keen focus on how job and inflation data evolve in the lead-up to the next policy meeting in December. This decision led to a retreat in US two-year Treasury yields, subsequently weighing down the US Dollar.
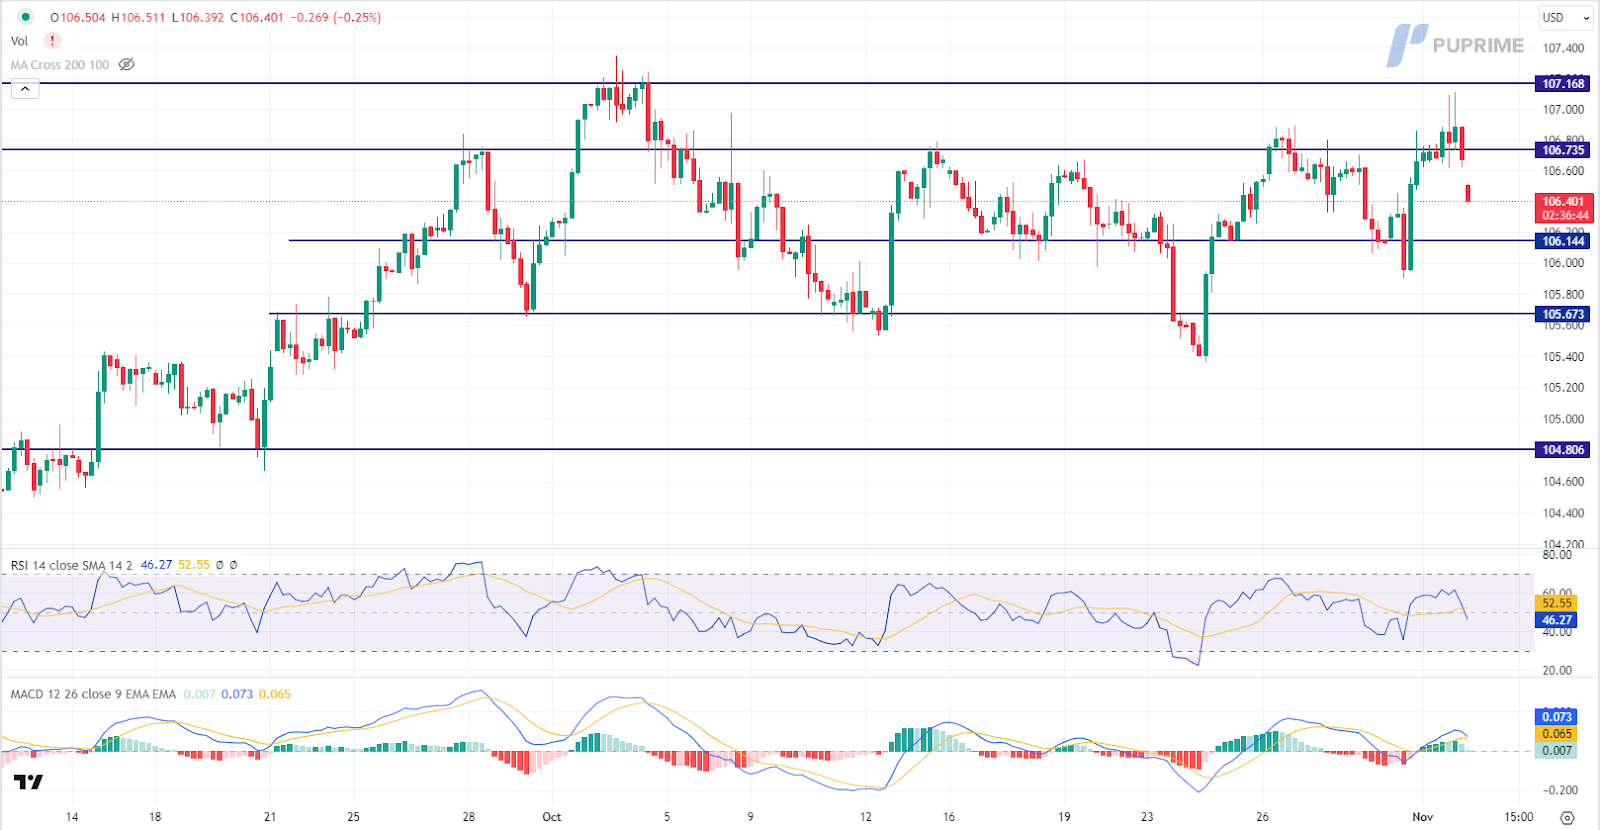
The Dollar Index is trading higher while currently testing the resistance level. MACD has illustrated increasing bullish momentum, while RSI is at 58, suggesting the index to extend its gains after breakout since the RSI stays above the midline.
Resistance level: 106.75, 107.15
Support level: 106.15, 105.65
Gold prices experienced a slight rebound from a pivotal support level at $1980, particularly due to the decline in two-year US Treasury yields following the Federal Reserve’s decision to maintain interest rates. The economic data from the US exhibited a mixed picture. On the downside, ADP Nonfarm Employment Change for October and ISM Manufacturing PMI for October fell short of expectations at 113K and 46.7, respectively, compared to the anticipated figures of 150K and 49. In contrast, ISM Manufacturing Prices and JOLTs Job Openings outperformed market expectations.
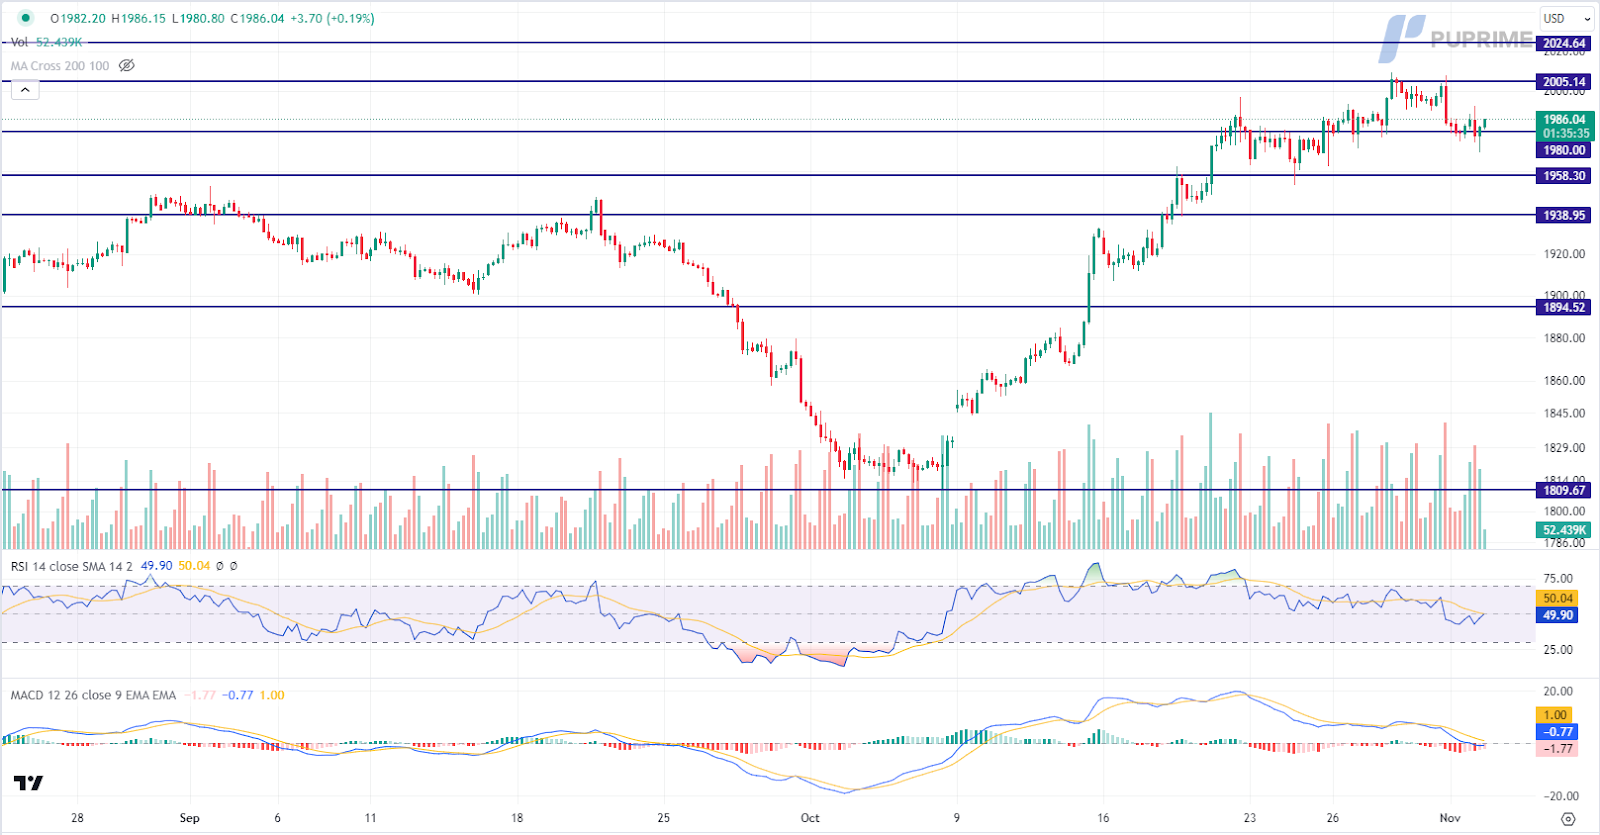
Gold is trading higher following the prior rebound from the support level. MACD has illustrated diminishing bearish momentum, while RSI si at 49, suggesting the commodity might extend its gains since the RSI rebounded from its oversold territory.
Resistance level: 2005.00, 2025.00
Support level: 1980.00, 1960.00
The euro found respite amid the Federal Reserve’s dovish stance, which curbed the dollar’s upward momentum. While Fed Chair Jerome Powell refrained from categorically dismissing future rate hikes, markets are abuzz with speculation about the possibility of a resumption in the Fed’s rate hike cycle come December.
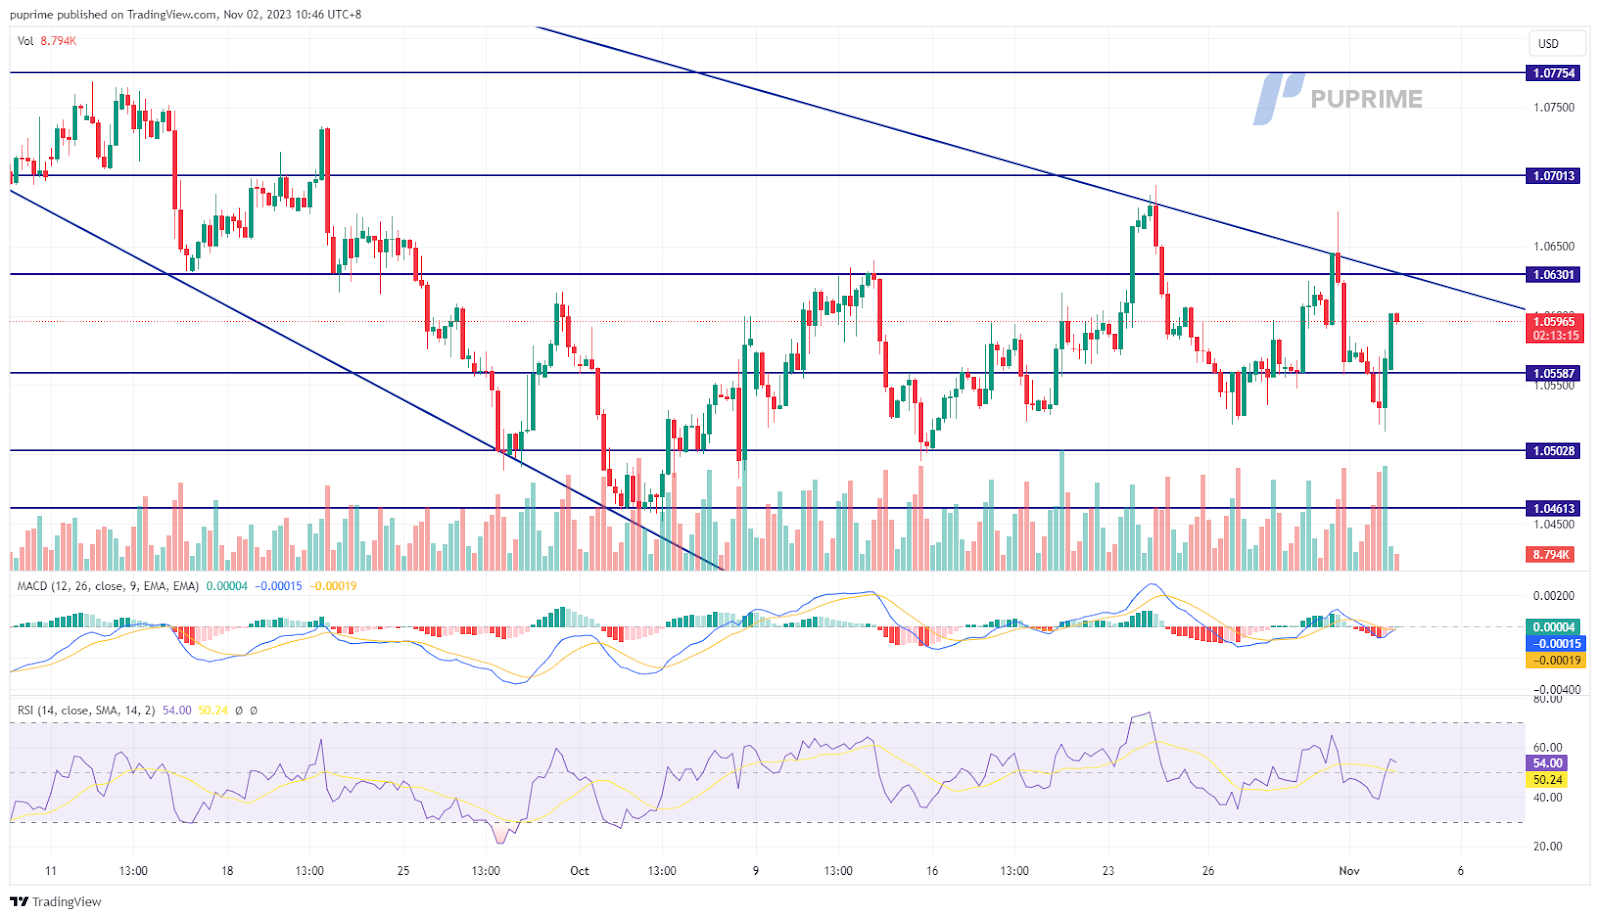
EUR/USD experienced a modest gain due to fundamental factors; the pair is still trading under its long-term downtrend resistance level. The momentum indicators move with little fluctuation, which gives a neutral signal for the pair.
Resistance level: 1.0630, 1.0700
Support level: 1.0560, 1.0500
The British Pound experienced heightened volatility after a period of calm trading, finding strength as the dollar weakened, influenced by the Federal Reserve’s dovish tone. Despite the Fed’s move softening the dollar’s momentum, the greenback held its ground, buoyed by the Fed Chair’s remarks indicating potential future rate hikes, hinging on sustained U.S. inflation. Meanwhile, the Bank of England is set to reveal its interest rate decision today, anticipated to echo the Fed’s approach with a pause in rate adjustments.
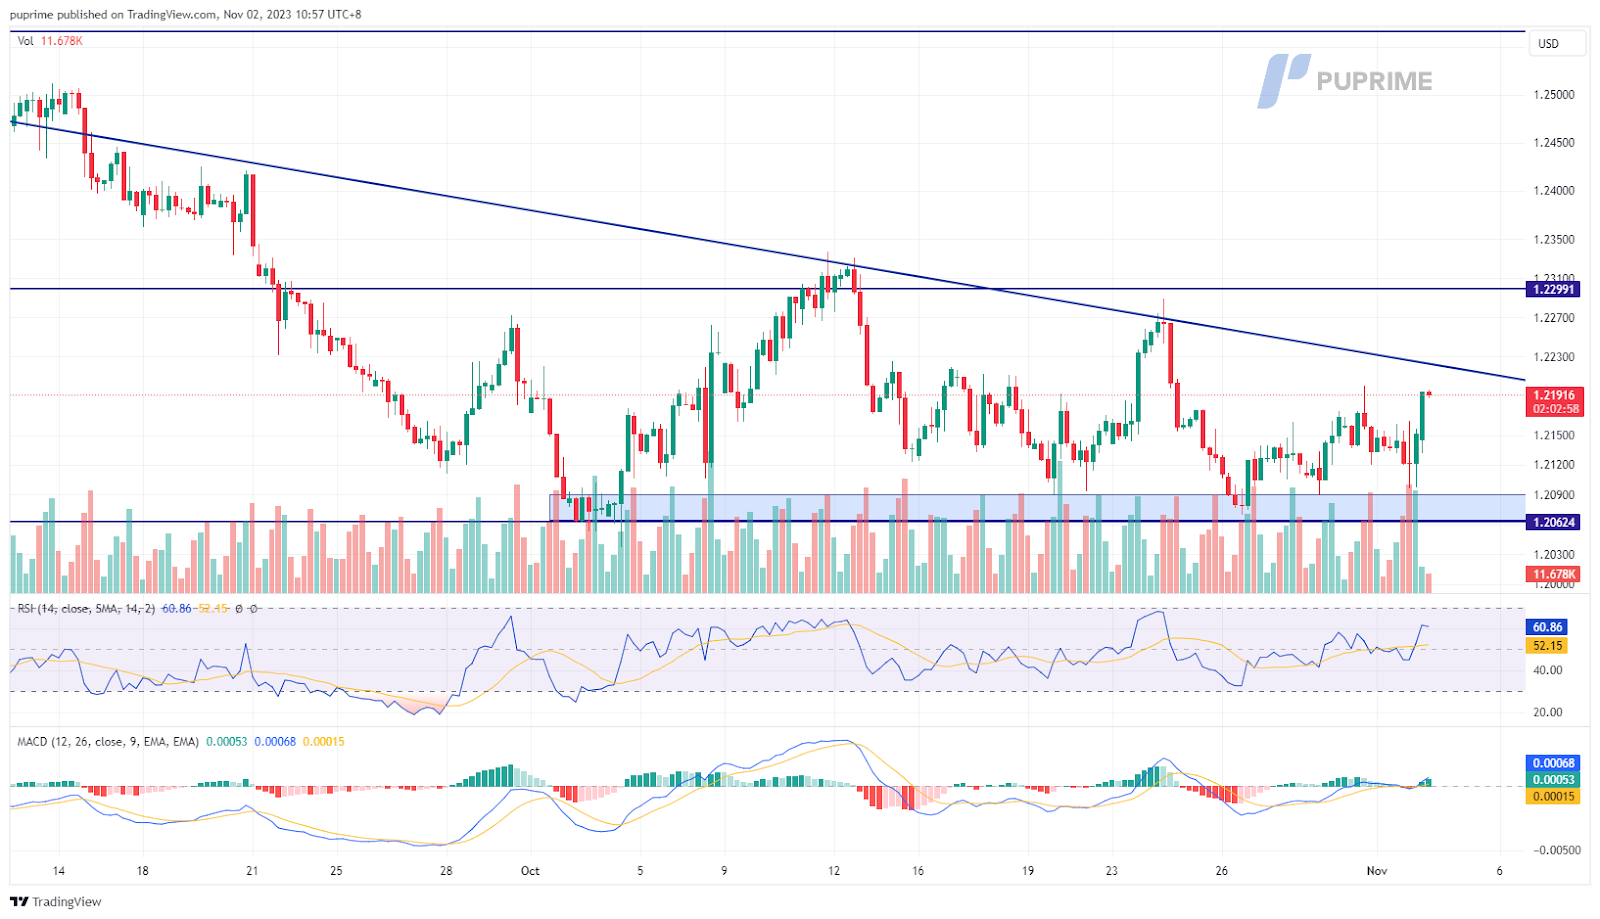
Despite a surge in yesterday’s trend, the Cable is still trading below its long-term downtrend resistance level. The RSI is approaching the overbought zone while the MACD has broken above the zero line, suggesting the bullish momentum is forming.
Resistance level: 1.2300, 1.2565
Support level: 1.2060, 1.1830
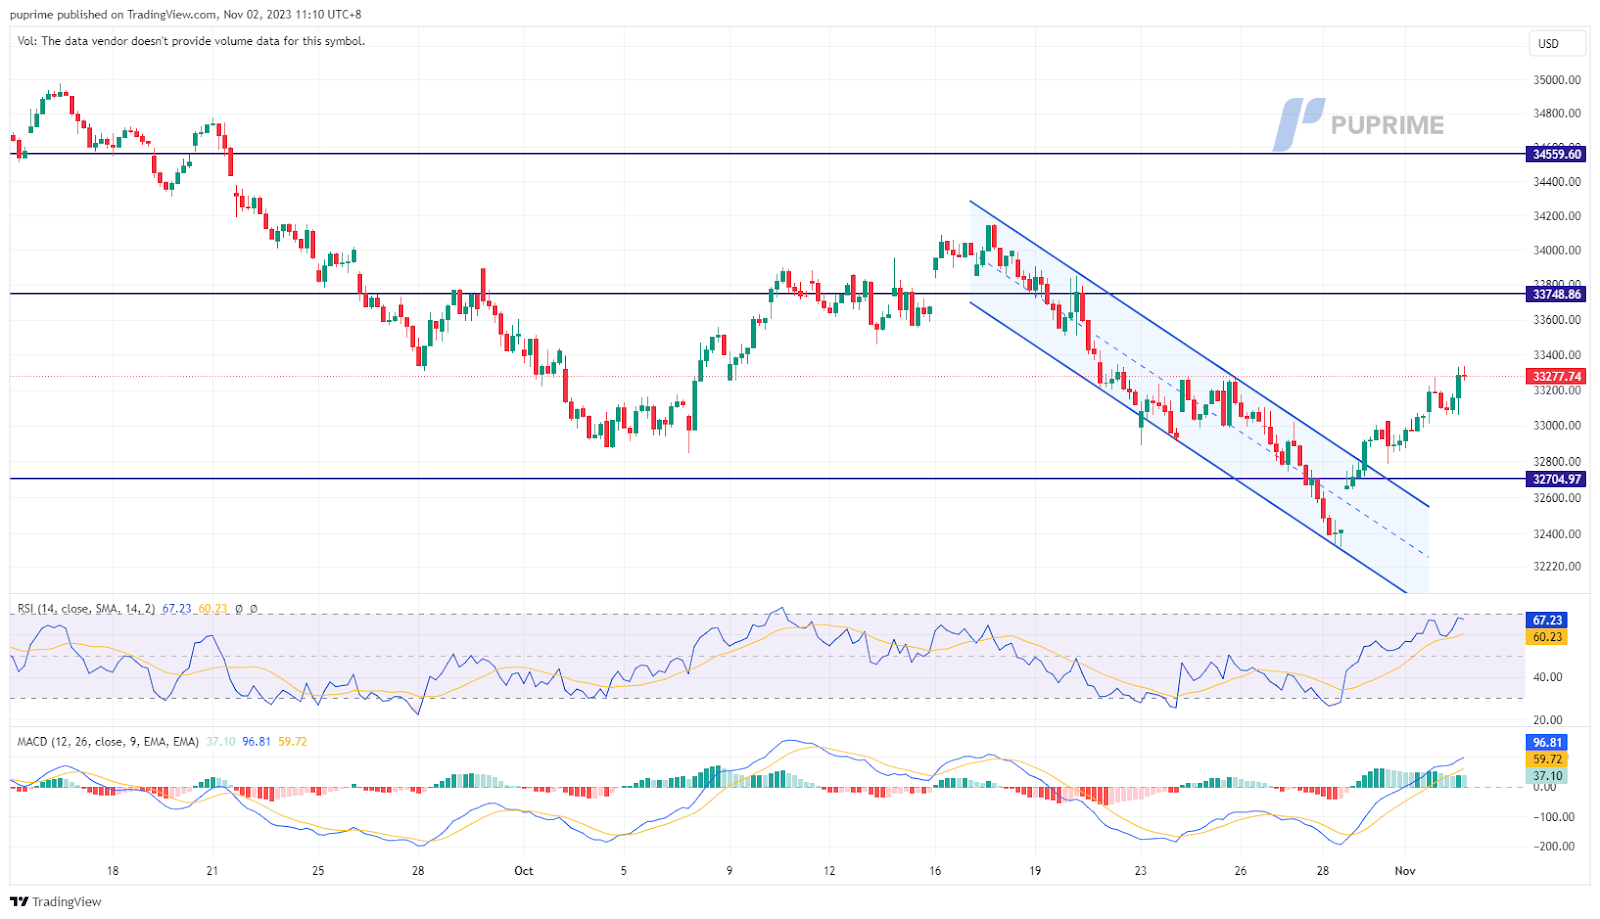
The Dow Jones Industrial Average extended its bullish trajectory, surging over 200 points in the latest session. The uptick was predominantly propelled by the Federal Reserve’s dovish stance, bolstering investor sentiment in the equity market. The Fed’s decision to pause interest rates aligned with market forecasts; nevertheless, Fed officials left room for future hikes should U.S. inflation persist.
The Dow sustained after it broke above the downtrend channel, suggesting a solid trend reversal signal for the index. The RSI is heading toward the overbought zone while the MACD is on the brink of breaking above the zero line, suggesting the bullish momentum is gaining.
Resistance level: 33750.00, 34600.00
Support level: 32700.00, 31900.00
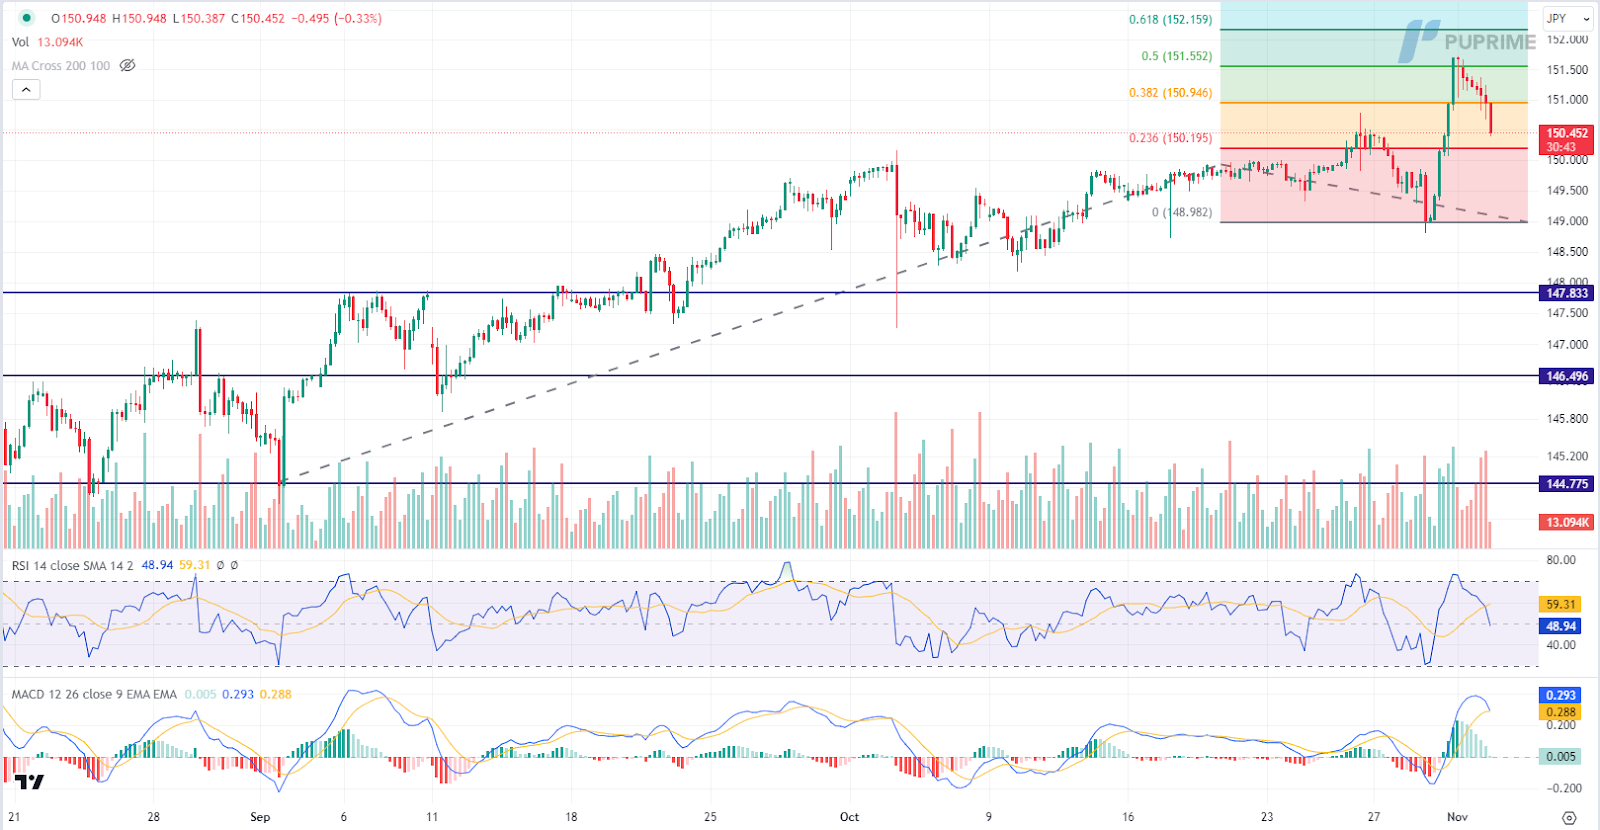
The Japanese yen saw a rebound after hitting a one-year low against the US Dollar, driven by fears of potential currency interventions by Japanese authorities. Furthermore, the Federal Reserve’s decision to keep interest rates unchanged narrowed the yield differential between Japan and the US, thereby limiting the demand for the Dollar and boosting demand for the Japanese yen. The prospect of currency intervention from the Bank of Japan continues to be a focus for investors.
USD/JPY is trading lower following the prior breakout below the previous support level. MACD has illustrated diminishing bullish momentum, while RSI is at 49, suggesting the pair might extend its losses since the RSI retreated sharply from overbought territory.
Resistance level: 150.95, 151.55
Support level: 150.20, 149.00
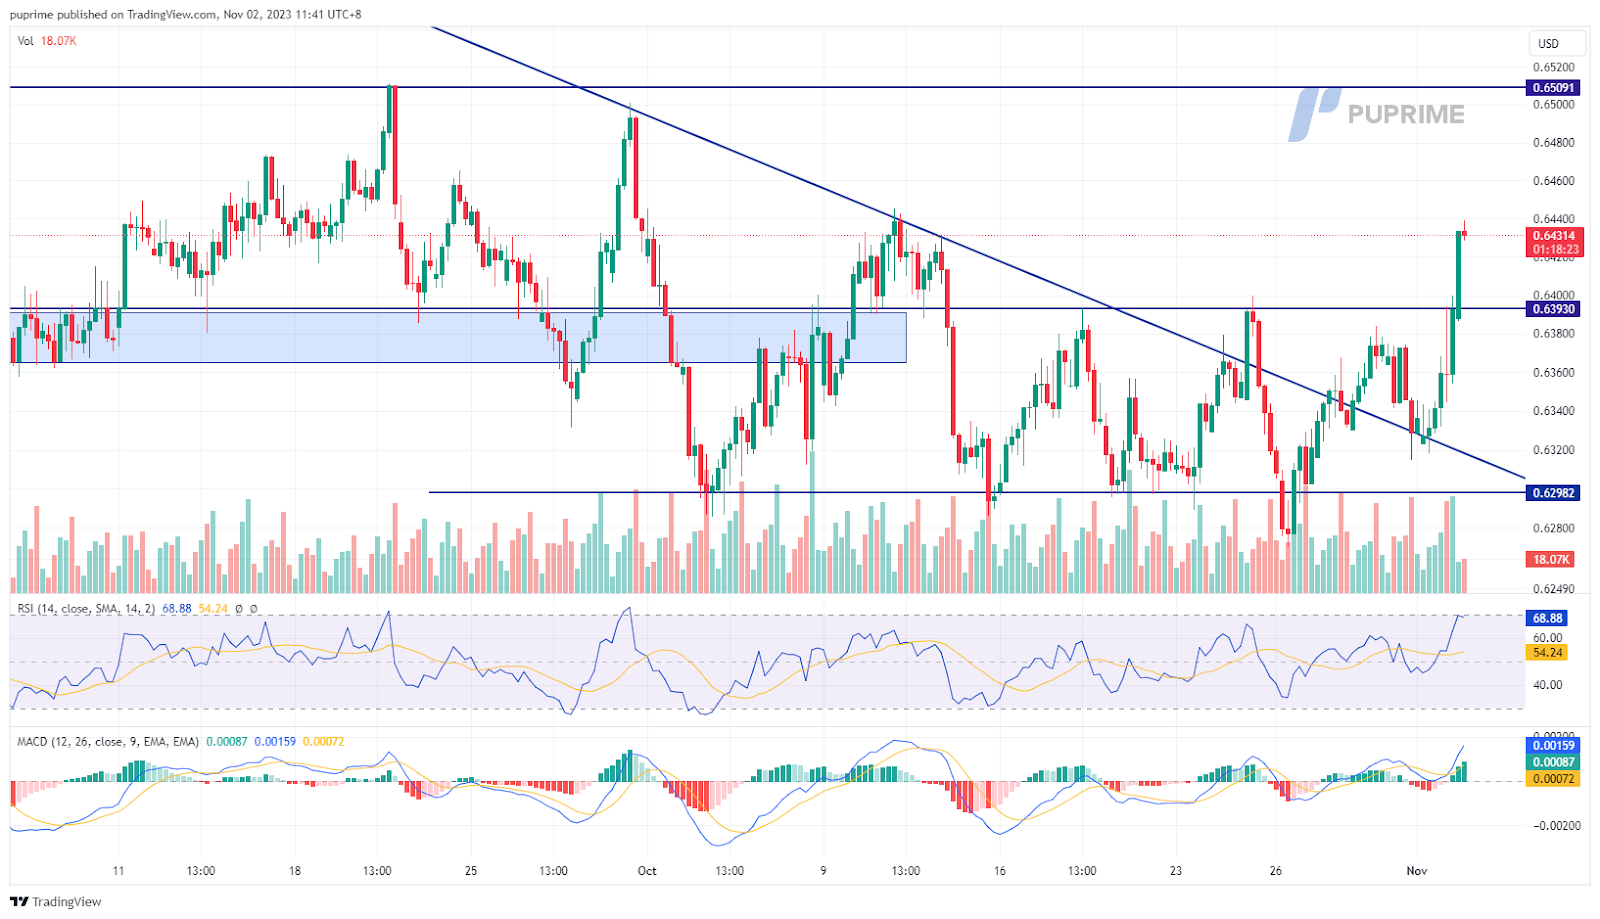
The AUD/USD pair staged a notable rebound from its previous resistance level, signalling a potential trend reversal. The pair’s uptrend was buoyed by the Federal Reserve’s dovish shift, which curtailed the dollar’s recent bullish run. However, the Aussie dollar faced headwinds as Australia’s trade data fell short of expectations, compounded by a significant drop in home loans, dampening the currency’s strength.
The AUD/USD pair rebounded sharply from above its then resistance level, signalling a bullish trend. The RSI is on the brink of breaking into the overbought zone while the MACD rebounded on the zero line, suggesting the bullish momentum is still intact.
Resistance level: 0.6395, 0.6510
Support level: 0.6300, 0.6205
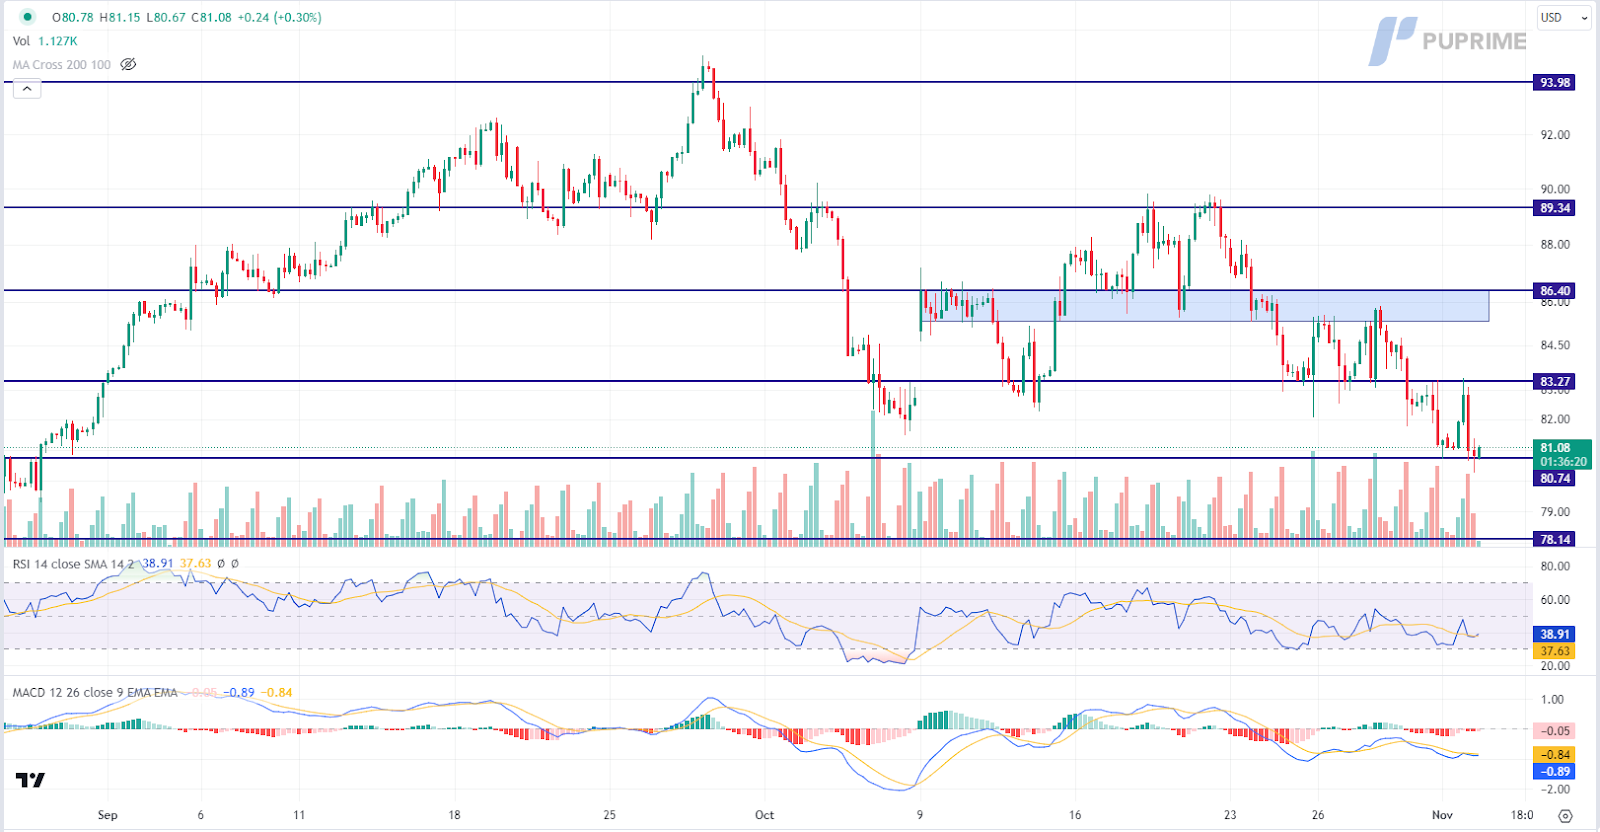
Oil prices have continued to trend negatively, weighed down by a pessimistic economic outlook that is suppressing demand, overshadowing geopolitical tensions in the Middle East. Unexpected contraction in manufacturing activity in China, the world’s largest oil importer, during October has added to uncertainties about the Chinese economic outlook. Nevertheless, oil supply disruption concerns persist as rising geopolitical tensions were noted, particularly as Iran’s Supreme Leader Ayatollah Ali Khamenei called on Muslim states to cease oil and food exports to Israel, demanding an end to its bombardment of the Gaza Strip.
Oil prices are trading lower while currently testing the support level. MACD has illustrated increasing bearish momentum, while RSI is at 33, suggesting the commodity might extend its losses after breakout since the RSI stays below the midline.
Resistance level: 83.25, 86.40
Support level: 80.75, 78.15
Step into the world of trading with confidence today. Open a free PU Prime live CFD trading account now to experience real-time market action, or refine your strategies risk-free with our demo account.
This content is for educational and informational purposes only and should not be considered investment advice, a personal recommendation, or an offer to buy or sell any financial instruments.
This material has been prepared without considering any individual investment objectives, financial situations. Any references to past performance of a financial instrument, index, or investment product are not indicative of future results.
PU Prime makes no representation as to the accuracy or completeness of this content and accepts no liability for any loss or damage arising from reliance on the information provided. Trading involves risk, and you should carefully consider your investment objectives and risk tolerance before making any trading decisions. Never invest more than you can afford to lose.

Trade forex, indices, metal, and more at industry-low spreads and lightning-fast execution.
Sign up for a PU Prime Live Account with our hassle-free process.
Effortlessly fund your account with a wide range of channels and accepted currencies.
Access hundreds of instruments under market-leading trading conditions.
Trading Platforms
Learn
About PU Prime
Corporate

Please note the Website is intended for individuals residing in jurisdictions where accessing the Website is permitted by law.
Please note that PU Prime and its affiliated entities are neither established nor operating in your home jurisdiction.
By clicking the "Acknowledge" button, you confirm that you are entering this website solely based on your initiative and not as a result of any specific marketing outreach. You wish to obtain information from this website which is provided on reverse solicitation in accordance with the laws of your home jurisdiction.
Thank You for Your Acknowledgement!
Ten en cuenta que el sitio web está destinado a personas que residen en jurisdicciones donde el acceso al sitio web está permitido por la ley.
Ten en cuenta que PU Prime y sus entidades afiliadas no están establecidas ni operan en tu jurisdicción de origen.
Al hacer clic en el botón "Aceptar", confirmas que estás ingresando a este sitio web por tu propia iniciativa y no como resultado de ningún esfuerzo de marketing específico. Deseas obtener información de este sitio web que se proporciona mediante solicitud inversa de acuerdo con las leyes de tu jurisdicción de origen.
Thank You for Your Acknowledgement!