


-
- Trading Platforms
- PU Prime App
- MetaTrader 5
- MetaTrader 4
- PU Copy Trading
- Web Trader
- PU Social
-
- Trading Conditions
- Account Types
- Spreads, Costs & Swaps
- Deposits & Withdrawals
- Fee & Charges
- Trading Hours


EN
1 November 2023,05:27
Daily Market Analysis
1 November 2023, 05:27

The Japanese Yen weakened against the USD, hitting its lowest level since last October, after the Bank of Japan (BoJ) maintained its dovish stance in its recent interest rate decision. Investors now anticipate a shift in Japan’s monetary policy, with expectations of a move away from negative interest rates in April next year. Meanwhile, oil and gold prices declined as signs indicated the containment of the Middle East conflict. The US dollar index rebounded by over 0.5% ahead of the crucial Federal Reserve’s interest rate decision today. While the market expects a pause in rate hikes this November, some investors are betting on a potential resumption of the Fed’s monetary tightening cycle in December.
Current rate hike bets on 1st November Fed interest rate decision:
Source: CME Fedwatch Tool
0 bps (98.0%) VS 25 bps (2%)


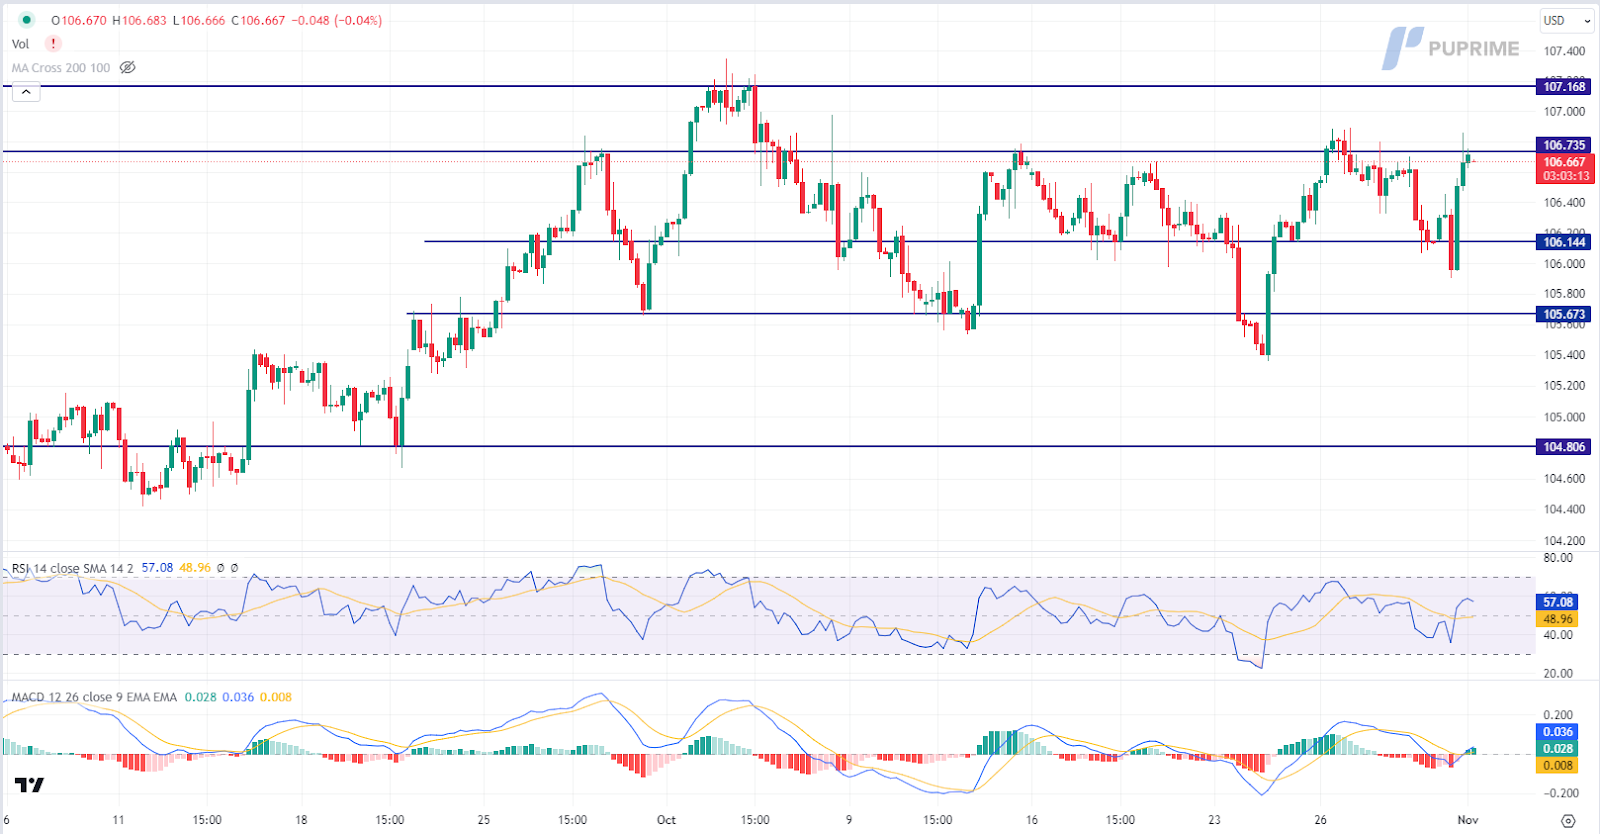
The US Dollar experienced a significant surge as investors shifted to the safe-haven currency amidst the pessimistic yen outlook. However, uncertainties persist ahead of the Federal Reserve’s two-day monetary policy meeting, where market participants await signals indicating the Fed’s future stance.
The Dollar Index is trading higher while currently testing the resistance level. MACD has illustrated increasing bullish momentum, while RSI is at 58, suggesting the index to extend its gains after breakout since the RSI stays above the midline.
Resistance level: 106.75, 107.15
Support level: 106.15, 105.65
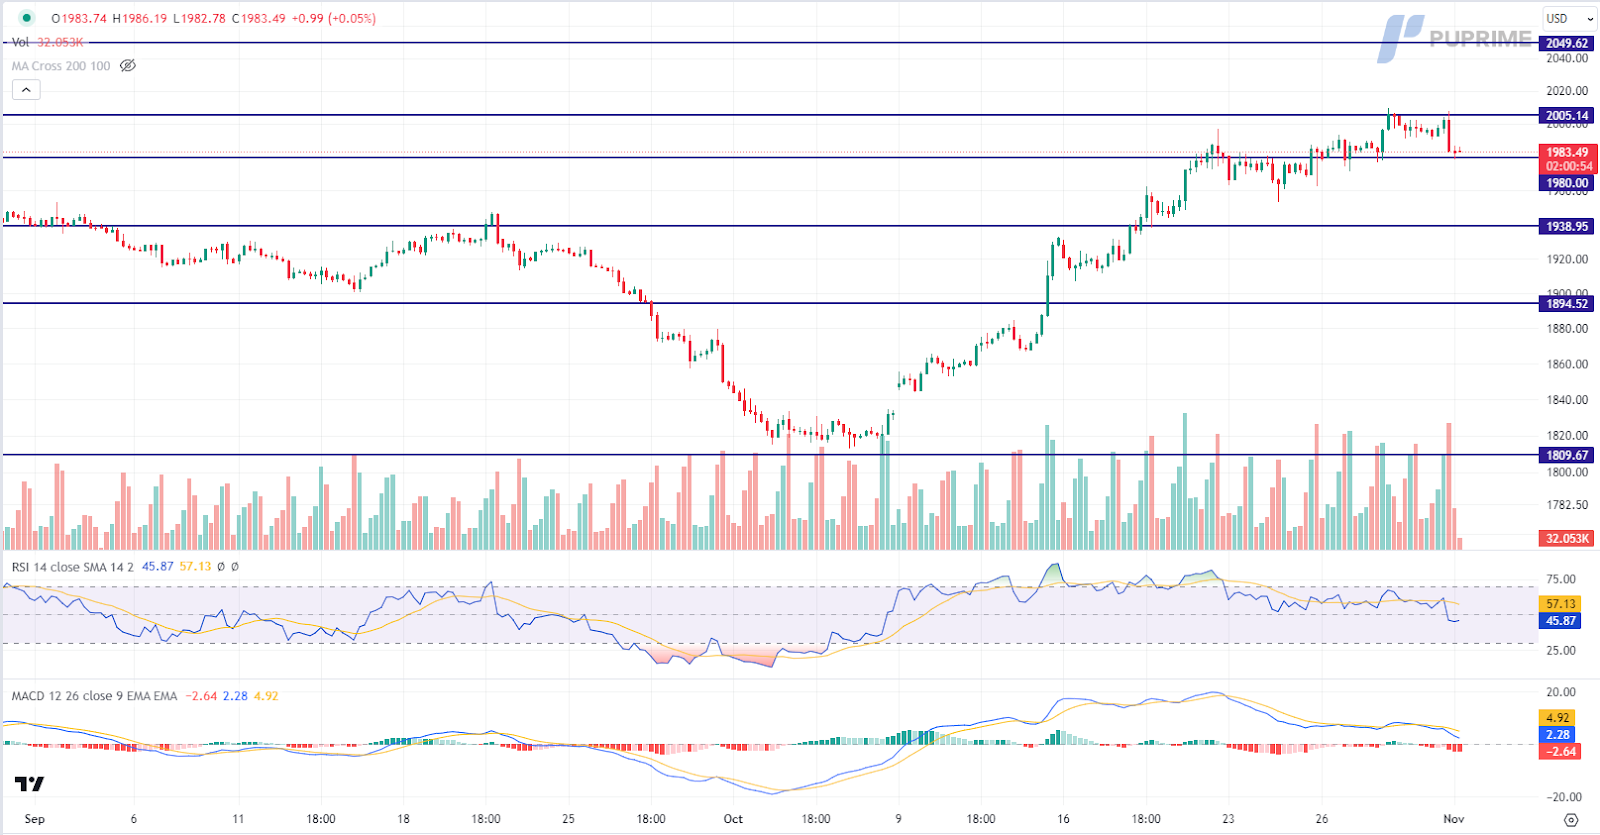
Gold prices retraced due to technical corrections in anticipation of pivotal events later in the week. Investors closely monitored the Federal Reserve’s monetary policy decisions, seeking trading signals. Additionally, the strengthening US Dollar exerted pressure on dollar-denominated gold.
Gold is trading lower while currently testing the support level. MACD has illustrated increasing bearish momentum, while RSI is at 46, suggesting the commodity might extend its losses after breakout since the RSI stays below the midline.
Resistance level: 2005.00, 2050.00
Support level: 1980.00, 1940.00
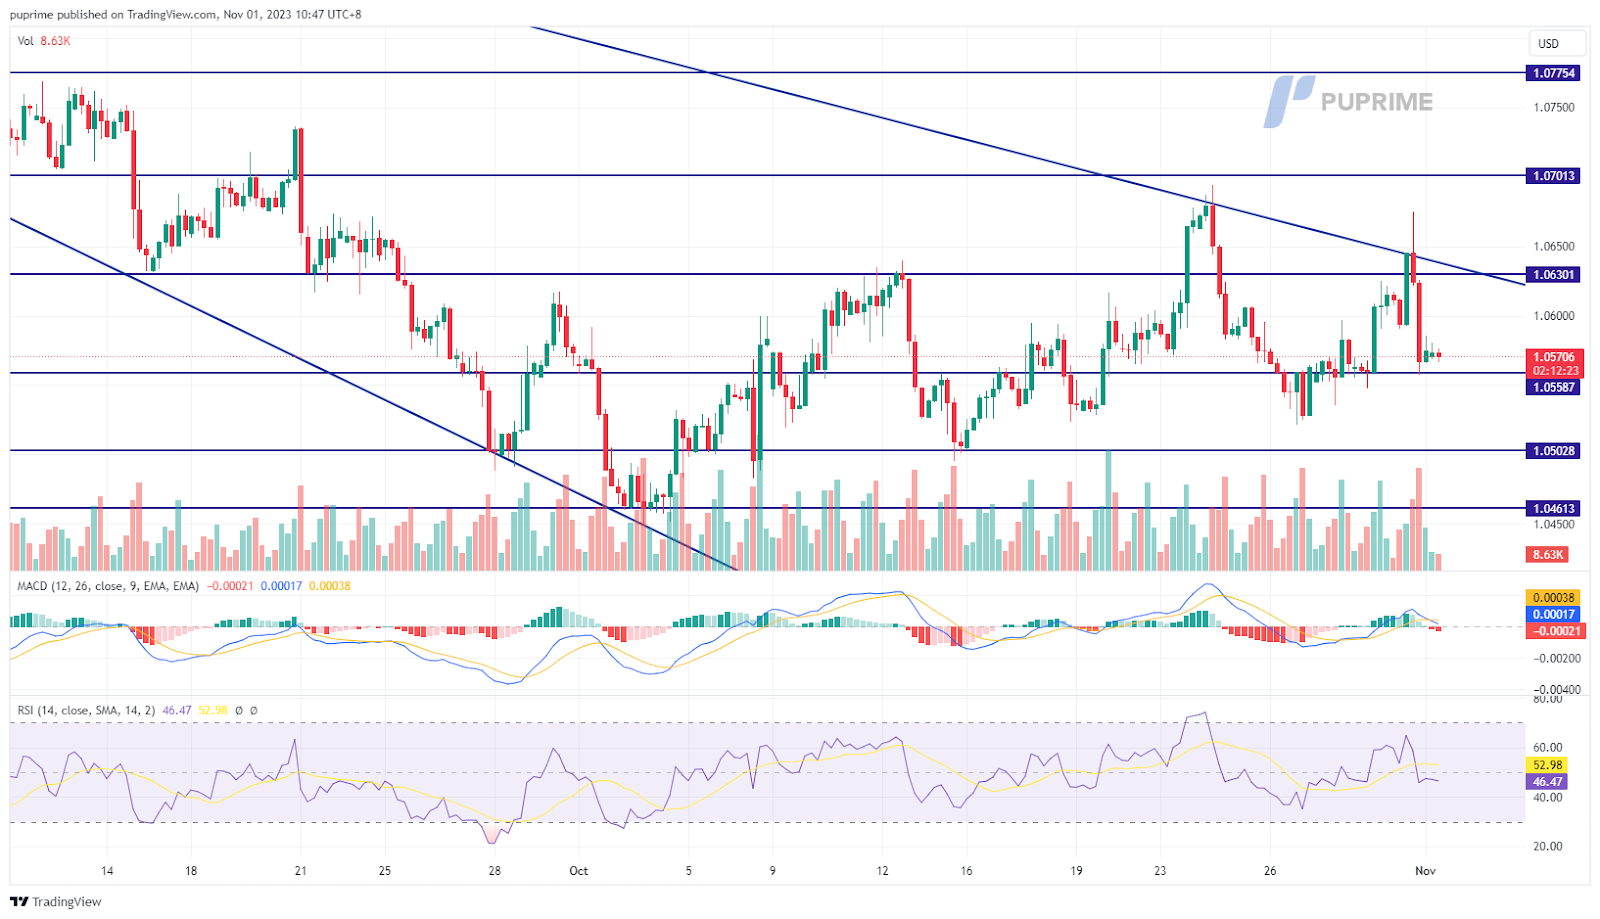
The euro faced a setback, slipping below its key support level at 1.0630, succumbing to the strengthening US dollar and disappointing economic data in the Eurozone. The dollar regained its momentum in anticipation of the imminent Federal Reserve interest rate decision, bolstered by positive economic indicators, which heightened expectations of continued rate hikes before the year’s end. Conversely, Eurozone economic data, particularly CPI and GDP figures, fell short of market expectations, adding downward pressure on the euro.
EUR/USD gain on Monday was erased due to fundamental factors, and a lower high price pattern has formed, signalling a long-term bearish trend. The MACD is approaching the zero line from above while the RSI has dropped to near 50 levels, suggesting the bullish momentum has vanished.
Resistance level: 1.0630, 1.0700
Support level: 1.0560, 1.0500
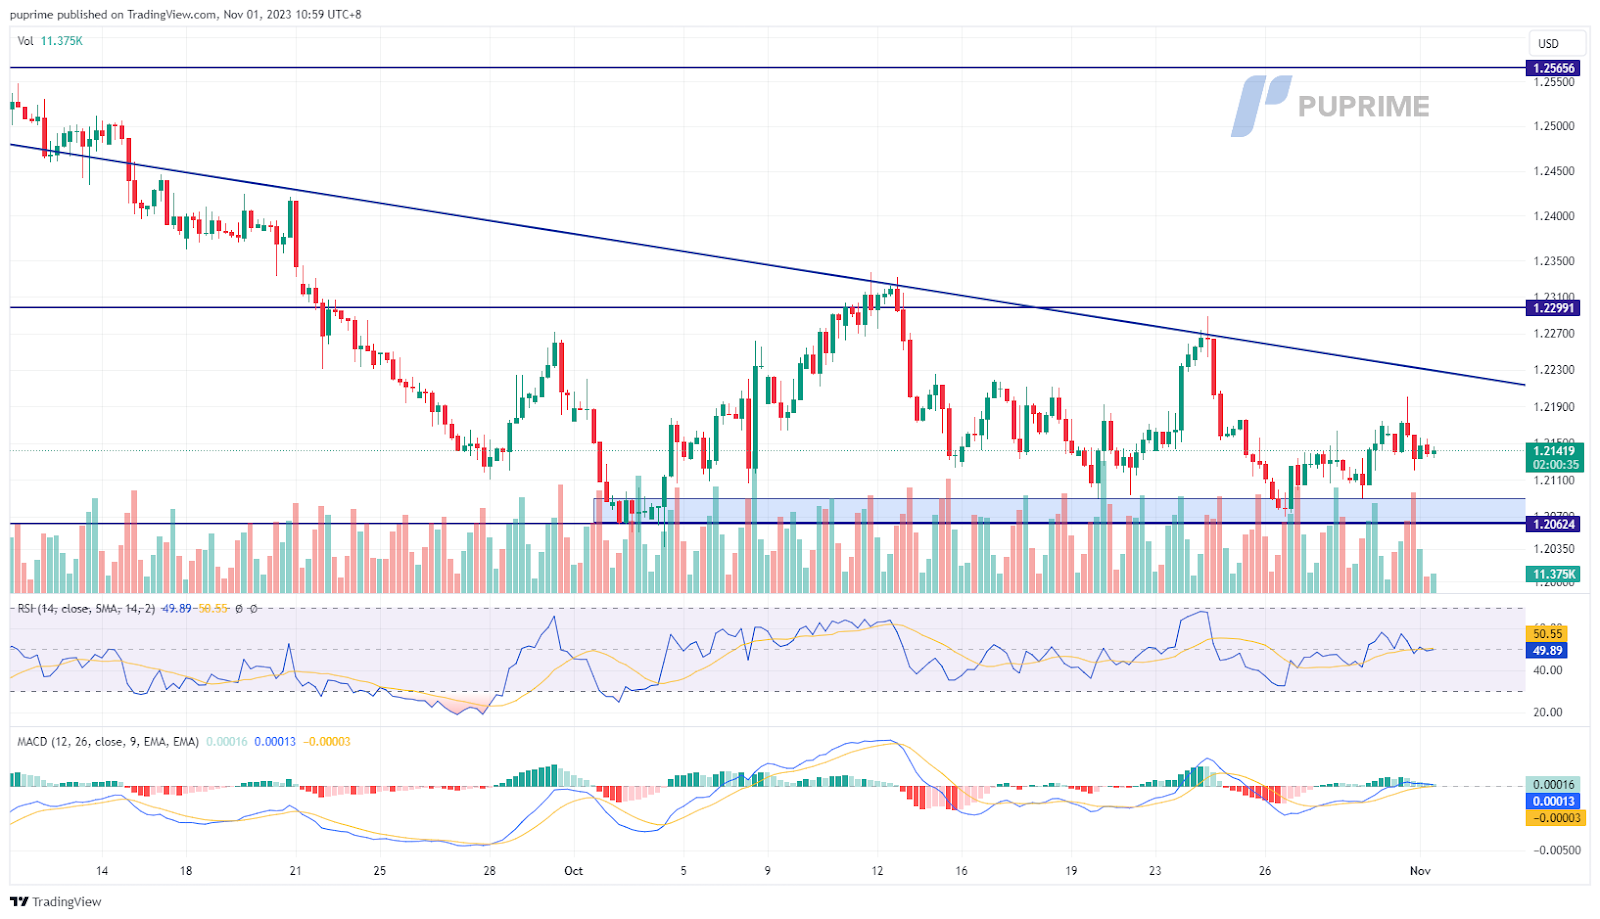
The British Pound (GBP/USD) weakened in the face of a robust U.S. dollar, spurred by better-than-expected US CB consumer confidence data. The upbeat economic indicator reinforced the dollar’s strength, overshadowing the Pound. Attention now turns to the Bank of England’s upcoming interest rate decision on Thursday, with market consensus leaning towards the central bank maintaining its current interest rate level due to uninspiring economic performance, signalling a cautious approach to further monetary tightening policies.
The volatility for the Cable is low ahead of crucial fundamental events. The RSI is flowing near the 50 level while the MACD is hovering near the zero line, which both gives a neutral signal for the Cable.
Resistance level: 1.2300, 1.2565
Support level: 1.2060, 1.1830
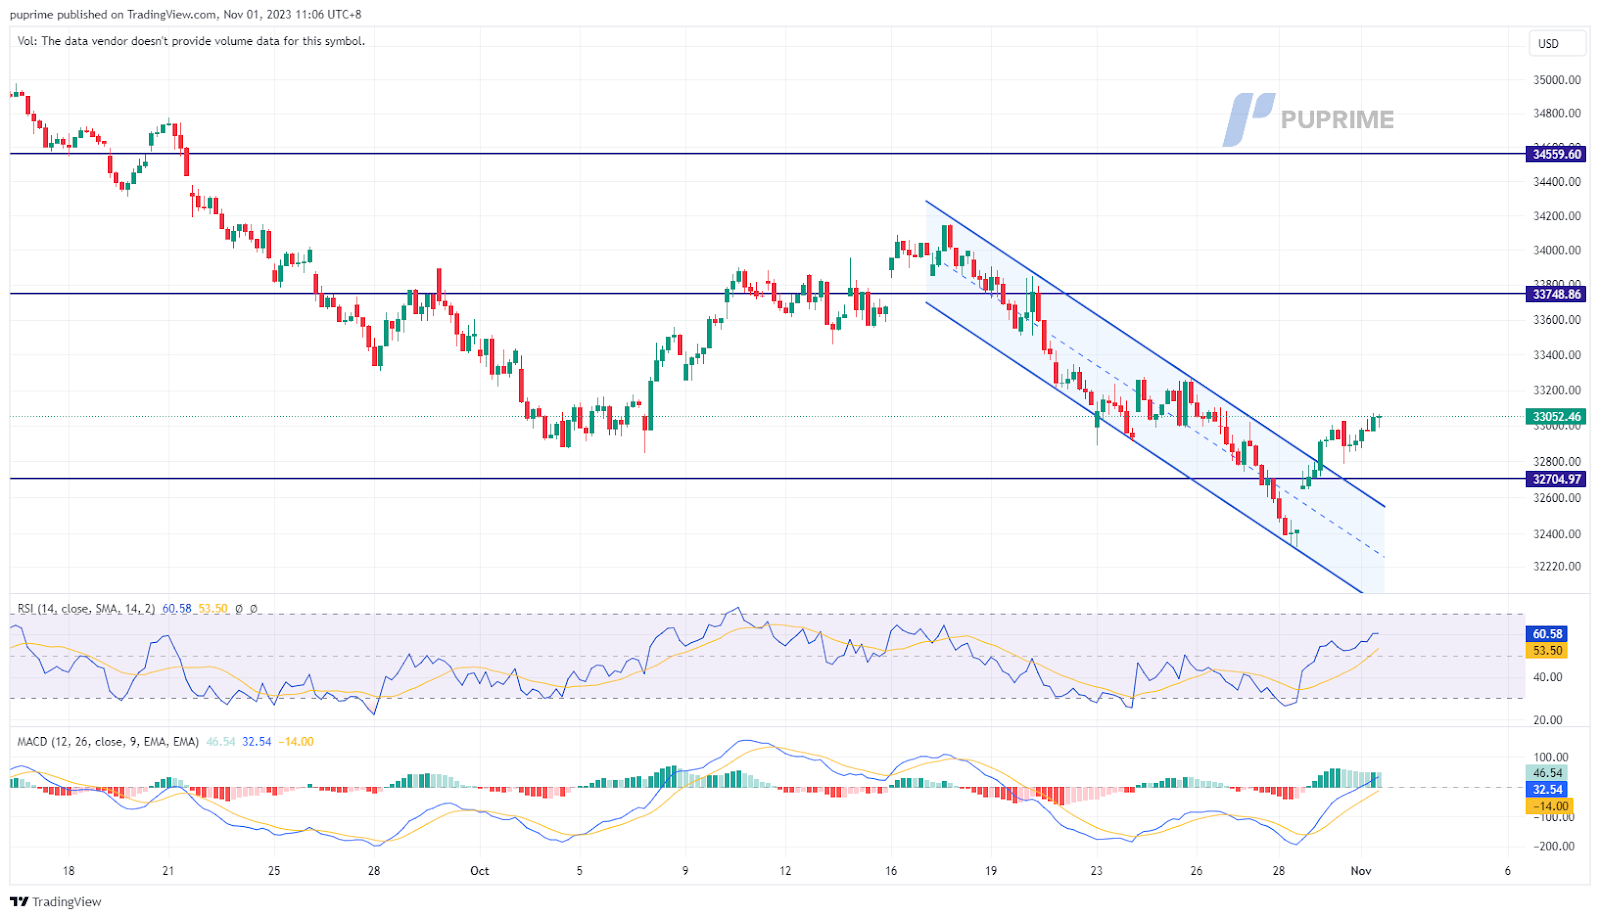
The Dow edged higher in anticipation of the pivotal Fed interest rate decision scheduled for later today. Notable blue-chip earnings reports, surpassing market expectations, provided a modest boost. However, investor sentiment remains cautious as market participants await the Fed’s announcement. Equities are poised for potential stimulation if the decision aligns with expectations, marking a second consecutive rate pause.
The Dow sustained after it broke above the downtrend channel, suggesting a trend reversal for the index. The RSI is heading toward the overbought zone while the MACD is on the brink of breaking above the zero line, suggesting the bullish momentum is gaining.
Resistance level: 33750.00, 34600.00
Support level: 32700.00, 31900.00
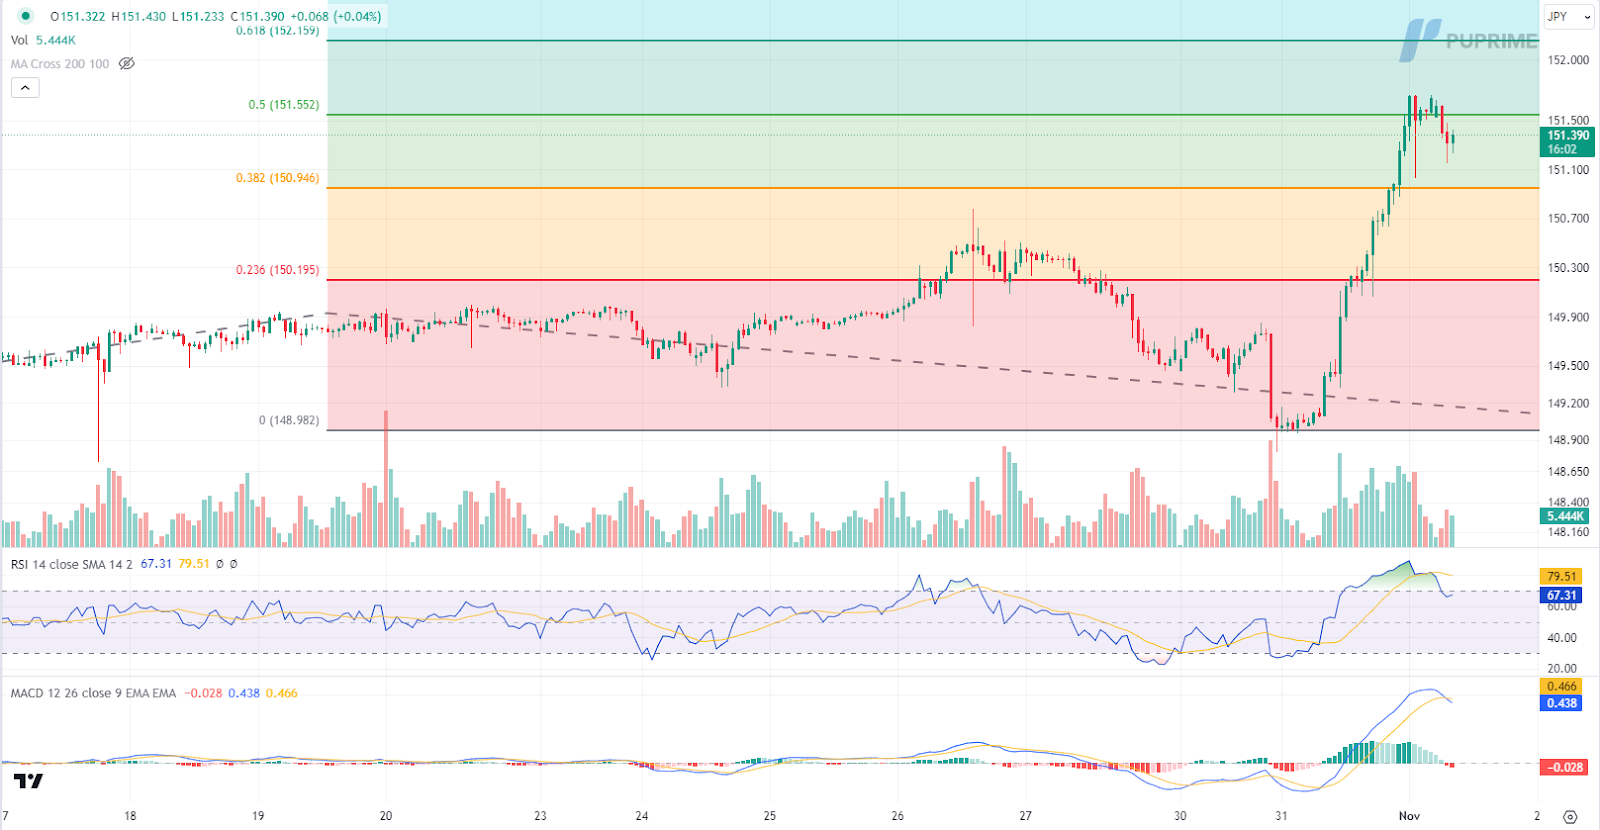
The Japanese yen depreciated broadly, hitting a 15-year low as the Bank of Japan’s recent efforts to loosen its monetary policy were perceived as inadequate. The bank relaxed its control on long-term rates by further adjusting its bond yield control policy (YCC), allowing the yield to move up to a 1% cap on the 10-year bond yield, which was intended to increase its long-term borrowing costs. Nevertheless, many investors and analysts believe these measures might have come too late and could be insufficient to prevent further devaluation of the Japanese yen.
USD/JPY is higher while currently testing the resistance level. However, MACD has illustrated increasing bearish momentum, while RSI isa t 67, suggesting the pair might enter overbought territory.
Resistance level: 151.55, 152.15
Support level: 150.95, 150.20
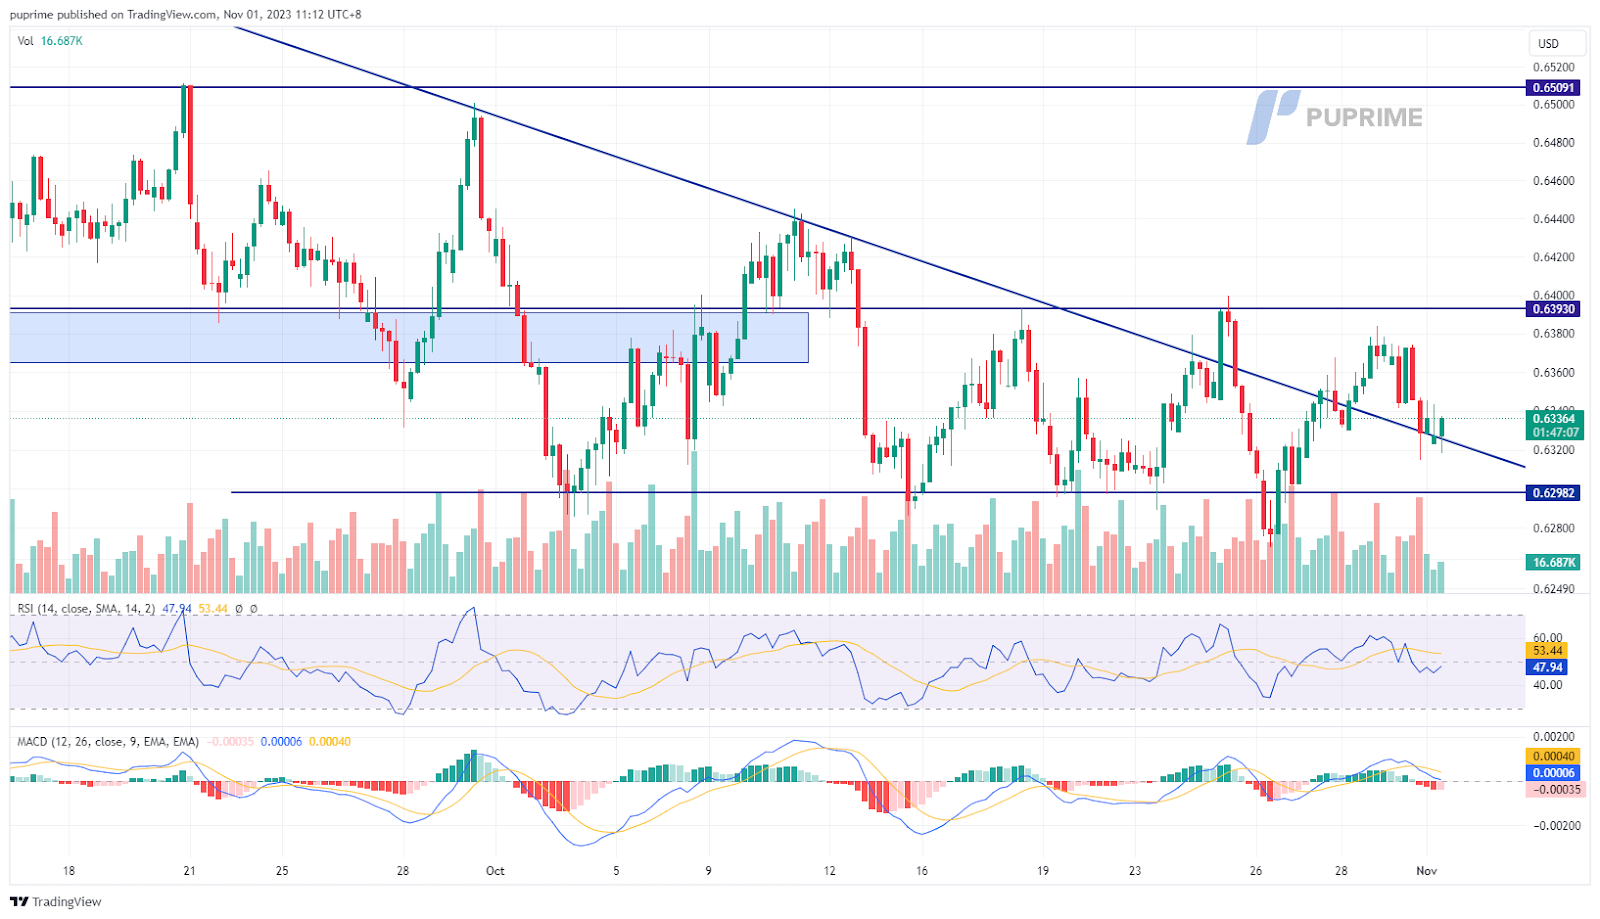
The AUD/USD pair faced downward pressure due to a robust dollar and discouraging data from China’s Caixin Manufacturing PMI, indicating ongoing economic challenges in China. The dollar’s strength was further bolstered by positive U.S. economic data, fueling optimism that the Fed might resume its rate hike cycle in December.
AUD/USD declined yesterday but remained above its previous downtrend resistance level, suggesting that the bullish momentum is still intact with the pair. The RSI has dropped to near the 50 level while the MACD is approaching the zero line from above, suggesting the bullish momentum has decreased drastically.
Resistance level: 0.6395, 0.6510
Support level: 0.6300, 0.6205
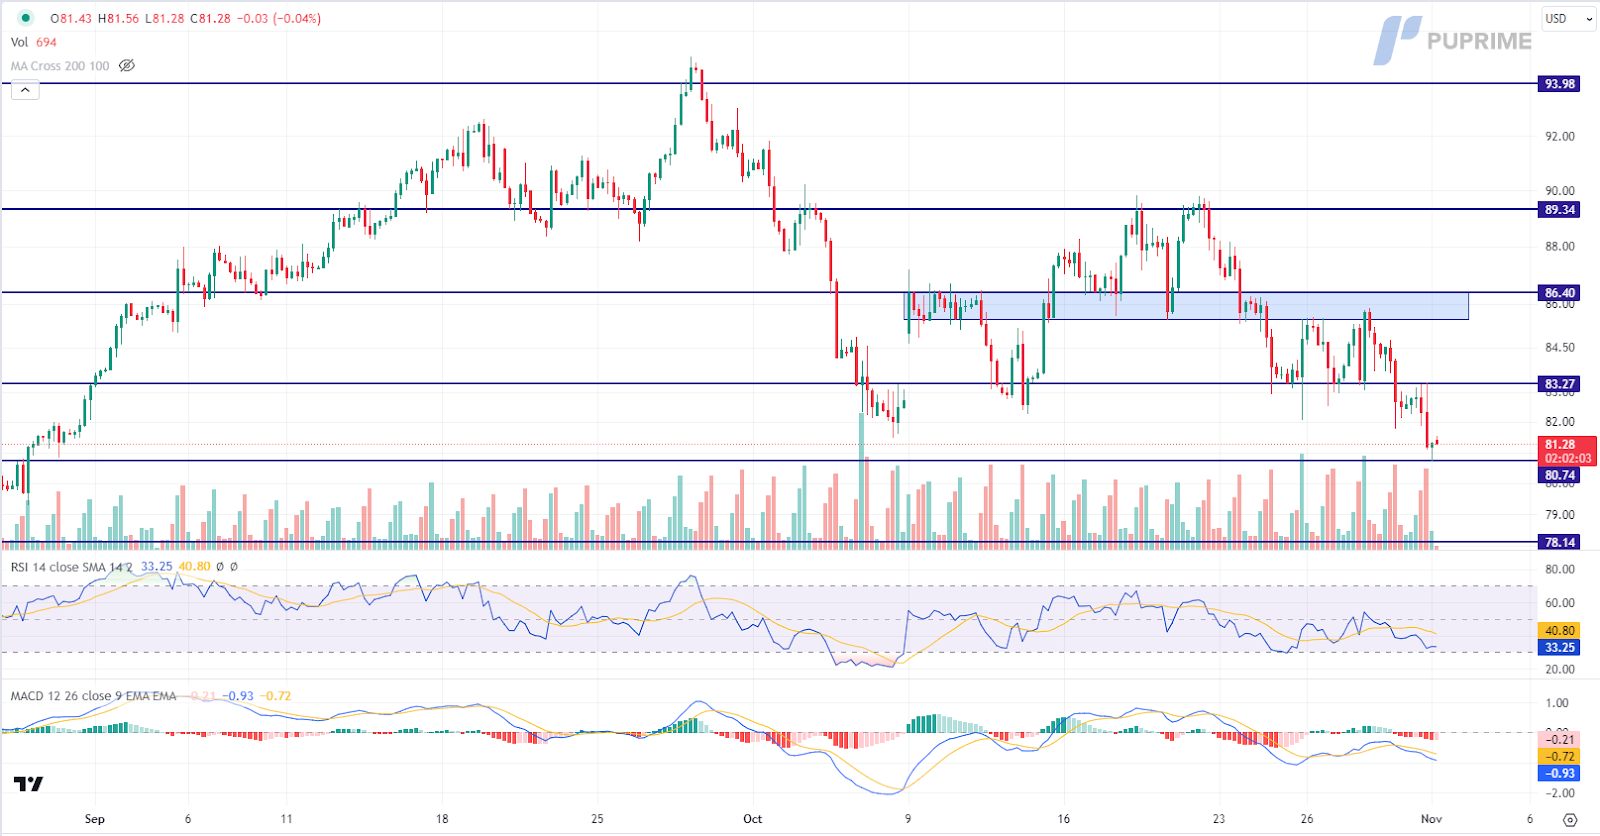
Oil markets faced declines but managed to stabilise after hitting crucial support levels. Weaker oil demand due to disappointing economic data from China was countered by bullish momentum from ongoing Israel-Hamas tensions. China’s contracting manufacturing and slowed non-manufacturing growth highlighted challenges in the country’s economic recovery despite stimulus efforts.
Oil prices are trading lower while currently testing the support level. MACD has illustrated increasing bearish momentum, while RSI is at 33, suggesting the commodity might extend its losses after breakout since the RSI stays below the midline.
Resistance level: 83.25, 86.40
Support level: 80.75, 78.15
Step into the world of trading with confidence today. Open a free PU Prime live CFD trading account now to experience real-time market action, or refine your strategies risk-free with our demo account.
This content is for educational and informational purposes only and should not be considered investment advice, a personal recommendation, or an offer to buy or sell any financial instruments.
This material has been prepared without considering any individual investment objectives, financial situations. Any references to past performance of a financial instrument, index, or investment product are not indicative of future results.
PU Prime makes no representation as to the accuracy or completeness of this content and accepts no liability for any loss or damage arising from reliance on the information provided. Trading involves risk, and you should carefully consider your investment objectives and risk tolerance before making any trading decisions. Never invest more than you can afford to lose.

Trade forex, indices, metal, and more at industry-low spreads and lightning-fast execution.
Sign up for a PU Prime Live Account with our hassle-free process.
Effortlessly fund your account with a wide range of channels and accepted currencies.
Access hundreds of instruments under market-leading trading conditions.
Trading Platforms
Learn
About PU Prime
Corporate

Please note the Website is intended for individuals residing in jurisdictions where accessing the Website is permitted by law.
Please note that PU Prime and its affiliated entities are neither established nor operating in your home jurisdiction.
By clicking the "Acknowledge" button, you confirm that you are entering this website solely based on your initiative and not as a result of any specific marketing outreach. You wish to obtain information from this website which is provided on reverse solicitation in accordance with the laws of your home jurisdiction.
Thank You for Your Acknowledgement!
Ten en cuenta que el sitio web está destinado a personas que residen en jurisdicciones donde el acceso al sitio web está permitido por la ley.
Ten en cuenta que PU Prime y sus entidades afiliadas no están establecidas ni operan en tu jurisdicción de origen.
Al hacer clic en el botón "Aceptar", confirmas que estás ingresando a este sitio web por tu propia iniciativa y no como resultado de ningún esfuerzo de marketing específico. Deseas obtener información de este sitio web que se proporciona mediante solicitud inversa de acuerdo con las leyes de tu jurisdicción de origen.
Thank You for Your Acknowledgement!