


-
- Trading Platforms
- PU Prime App
- MetaTrader 5
- MetaTrader 4
- PU Copy Trading
- Web Trader
- PU Social
-
- Trading Conditions
- Account Types
- Spreads, Costs & Swaps
- Deposits & Withdrawals
- Fee & Charges
- Trading Hours


EN
3 November 2023,05:42
Daily Market Analysis
3 November 2023, 05:42


In anticipation of the pivotal U.S. Nonfarm Payroll report slated for release today, the dollar index faced a significant setback, dropping nearly 0.5% overnight. This decline follows disappointing U.S. job data, which has cast doubt on the possibility of a December rate hike by the Federal Reserve. Initial jobless claims in the U.S. exceeded market expectations, and a contraction in earnings growth suggests that inflation remains under control. Meanwhile, the commodities market experienced downward pressure as signs of containment emerged in the Middle East conflict. Both oil and gold prices traded sideways amid easing geopolitical tensions. In contrast, the Australian dollar strengthened against the USD, fueled by speculation that the Reserve Bank of Australia (RBA) might resume its rate hike campaign. This optimism stems from Australia’s robust economic data over the past month, consistently surpassing market forecasts.
Current rate hike bets on 1st November Fed interest rate decision:
Source: CME Fedwatch Tool
0 bps (98.0%) VS 25 bps (2%)


A slide in the US Dollar was exacerbated by discouraging job data from the Department of Labour, revealing a rise in Initial Jobless Claims from 212K to 217K, surpassing the expected 210K. The underwhelming job figures have tempered market optimism about the US economic recovery, especially ahead of critical data releases such as Nonfarm Payrolls and the Unemployment Rate. Investors are advised to closely monitor these economic indicators for potential trading cues.
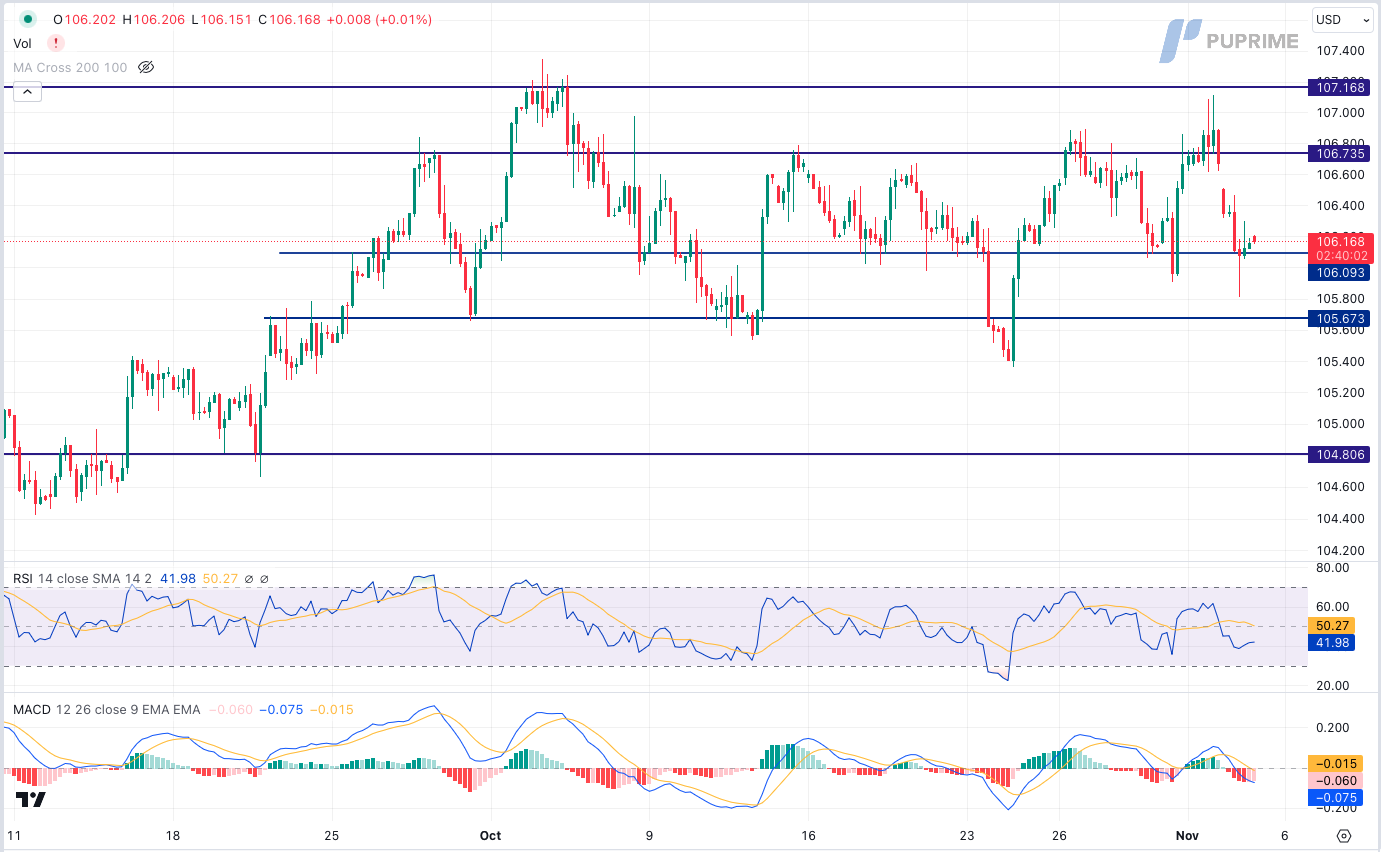
The Dollar Index is trading lower while currently testing the support level. However, MACD has illustrated diminishing bearish momentum, while RSI is at 42, suggesting the index might experience technical correction since the RSI moving toward the midline.
Resistance level: 106.75, 107.15
Support level: 106.10, 105.65
Despite a relatively flat trend, gold prices experienced a modest bullish surge, with investors exercising caution and awaiting vital job data from the US. Market participants are holding off for clearer signals to determine gold’s direction amidst ongoing market uncertainties.
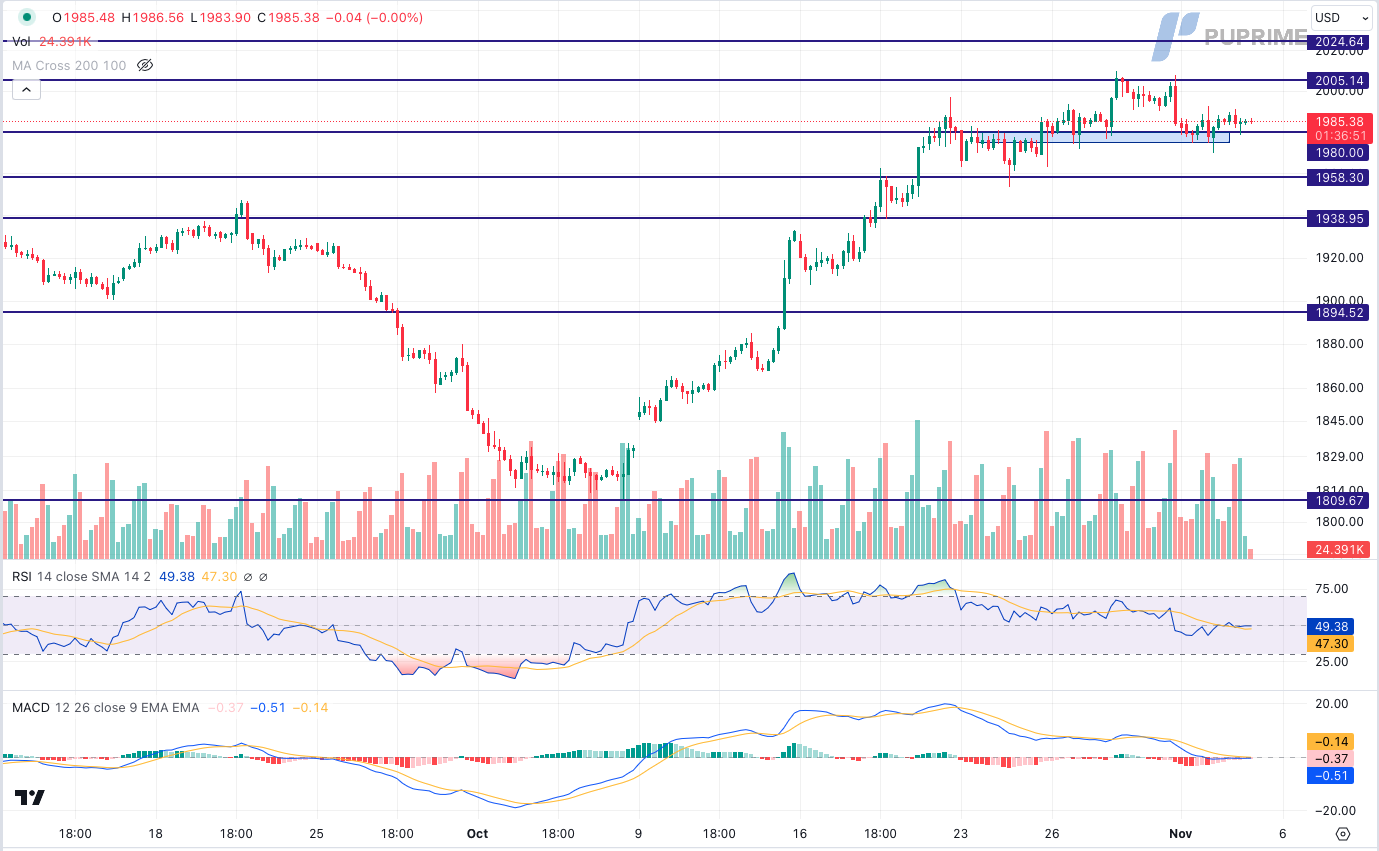
Gold is trading flat while currently testing the support level. MACD has illustrated diminishing bearish momentum, while RSI is at 49, suggesting the commodity might continue to consolidate in a range since the RSI near the midline.
Resistance level: 2005.00, 2025.00
Support level: 1980.00, 1960.00
The euro made modest gains yesterday, aiming to breach its long-term downtrend resistance level. Weaker U.S. job data undermined the dollar’s strength, dampening December rate hike expectations. Signs of softening inflation and elevated treasury yields led to speculation that U.S. interest rates have plateaued. While the dollar weakened, the euro still struggled due to lacklustre European economic performance, creating persistent challenges for the currency.
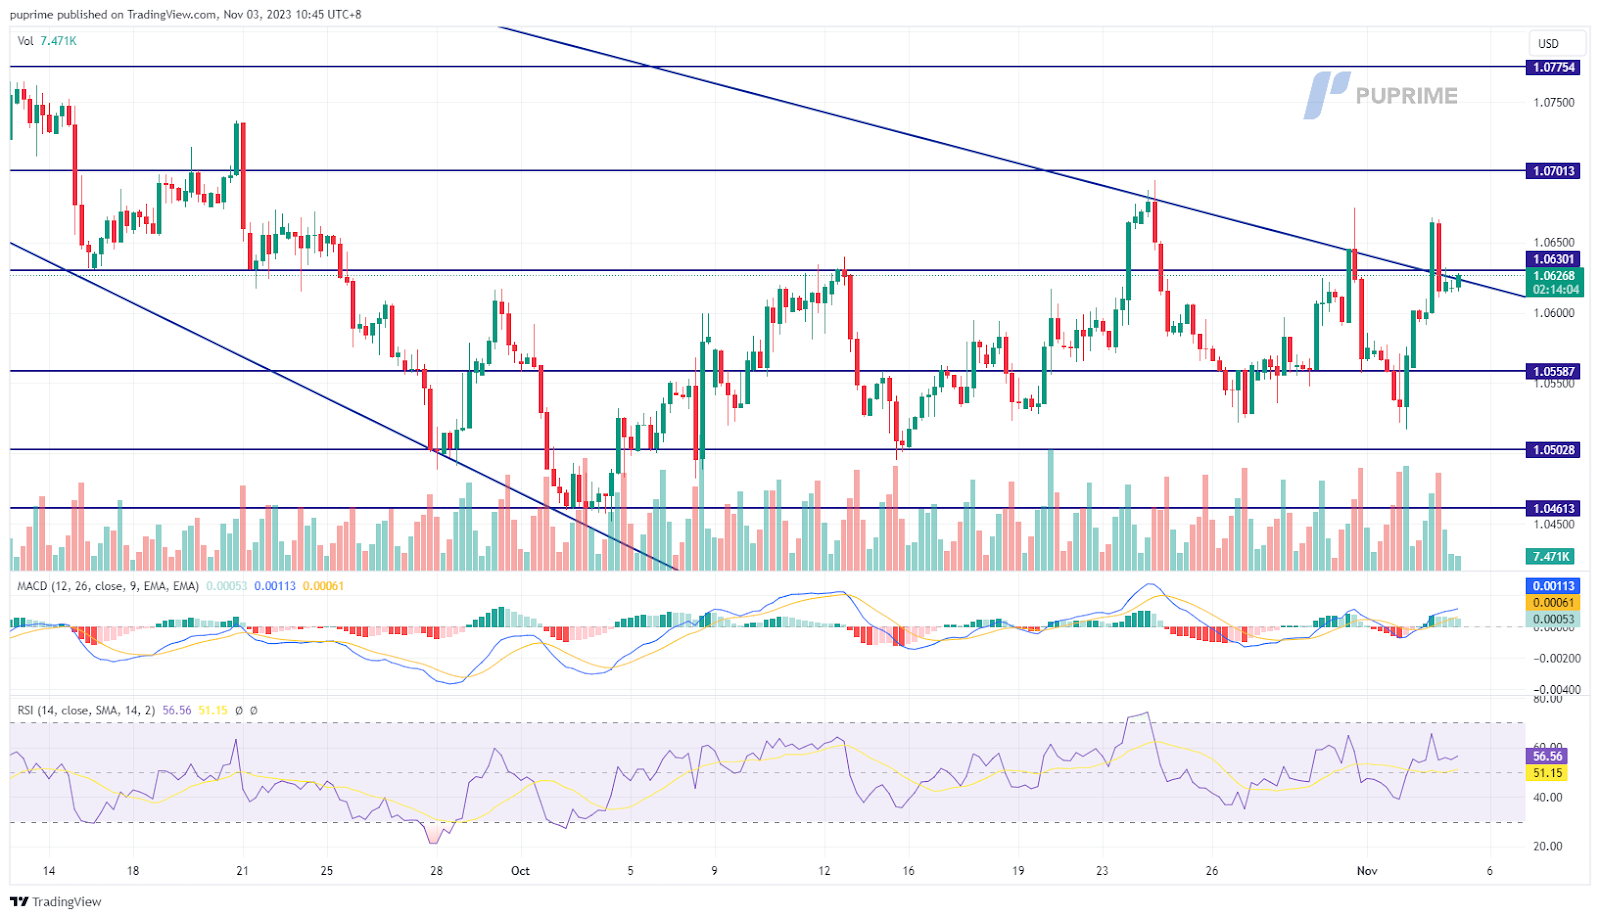
EUR/USD experienced a false breakout at its downtrend resistance level, suggesting the bullish momentum of the pair is not strong. The RSI hovering above the 50-level while the MACD flowing above the zero line, suggesting that bullish momentum is forming.
Resistance level: 1.0700, 1.0760
Support level: 1.0560, 1.0500
Pound Sterling saw an upward trajectory after the Bank of England’s decision to maintain its interest rates at a 15-year high, citing mounting inflation in the UK, surpassing other G7 nations. The Monetary Policy Committee emphasised its reluctance to consider rate cuts in the near term, holding rates steady at 5.25% following a string of consecutive rate increases.
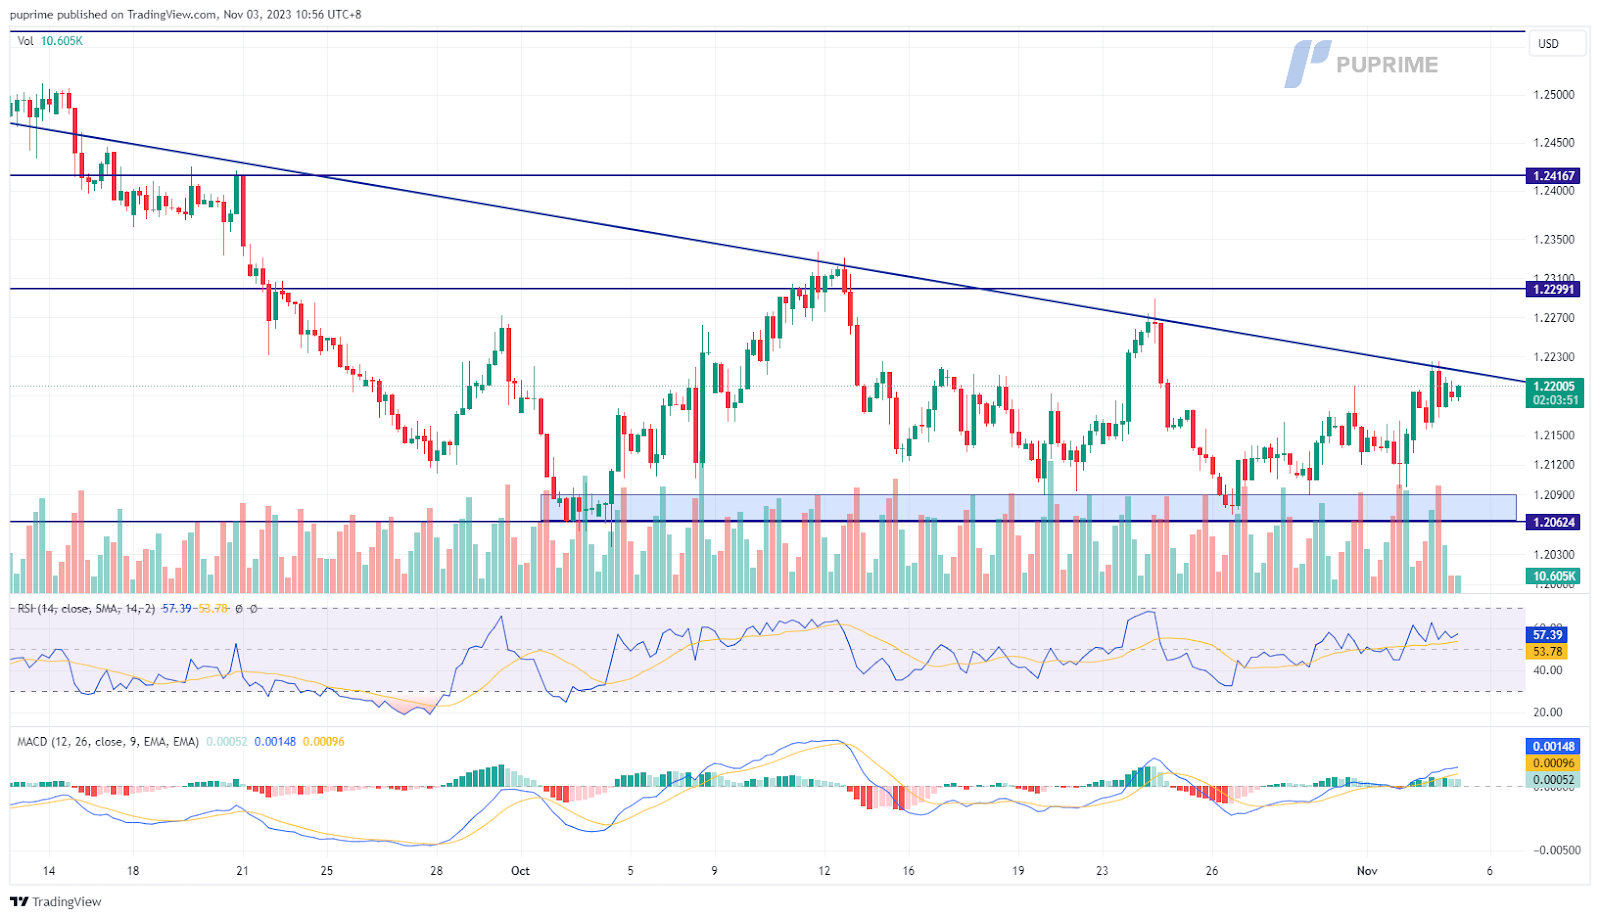
Despite a surge in yesterday’s trend, the Cable is still trading below its long-term downtrend resistance level. The RSI is approaching the overbought zone while the MACD has broken above the zero line, suggesting the bullish momentum is forming.
Resistance level: 1.2300, 1.2417
Support level: 1.2060, 1.1830
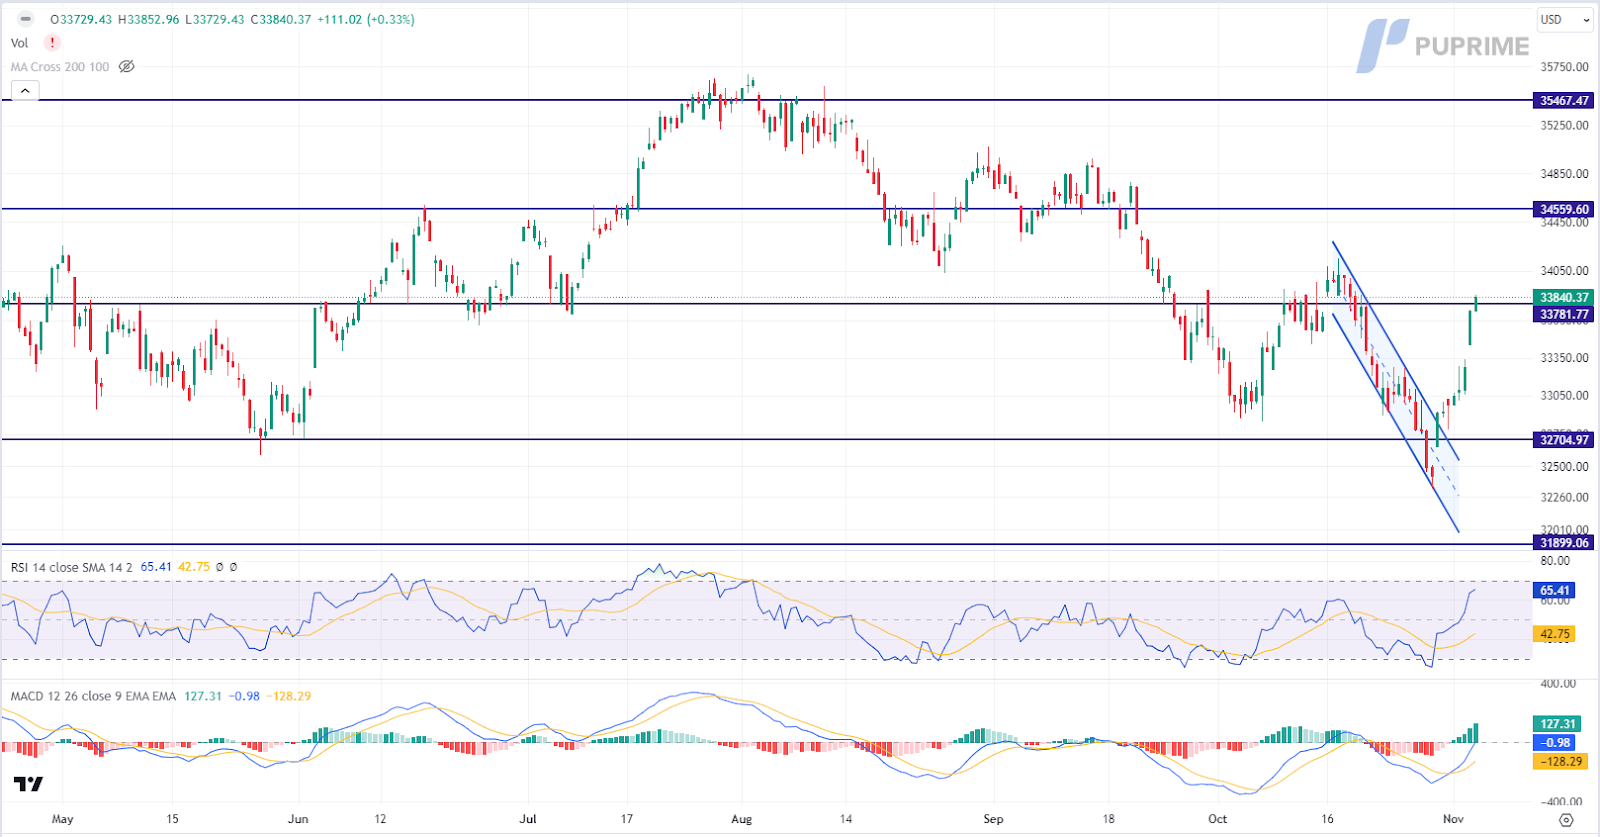
US equities experienced an upward trend, supported by a decline in US Treasury yields following the Federal Reserve’s recent meeting. The Fed’s decision to maintain unchanged interest rates was accompanied by cautious remarks about the continued uncertainty in the overall monetary landscape, emphasising a data-dependent approach. Investors are advised to closely monitor forthcoming US economic data for potential trading signals.
The Dow is trading higher following the prior breakout above the resistance level. MACD has illustrated increasing bullish momentum, while RSI is at 65, suggesting the index might extend its gains toward resistance level since the RSI stays above the midline.
Resistance level: 34560.00, 35465.00
Support level: 33780.00, 32705.00
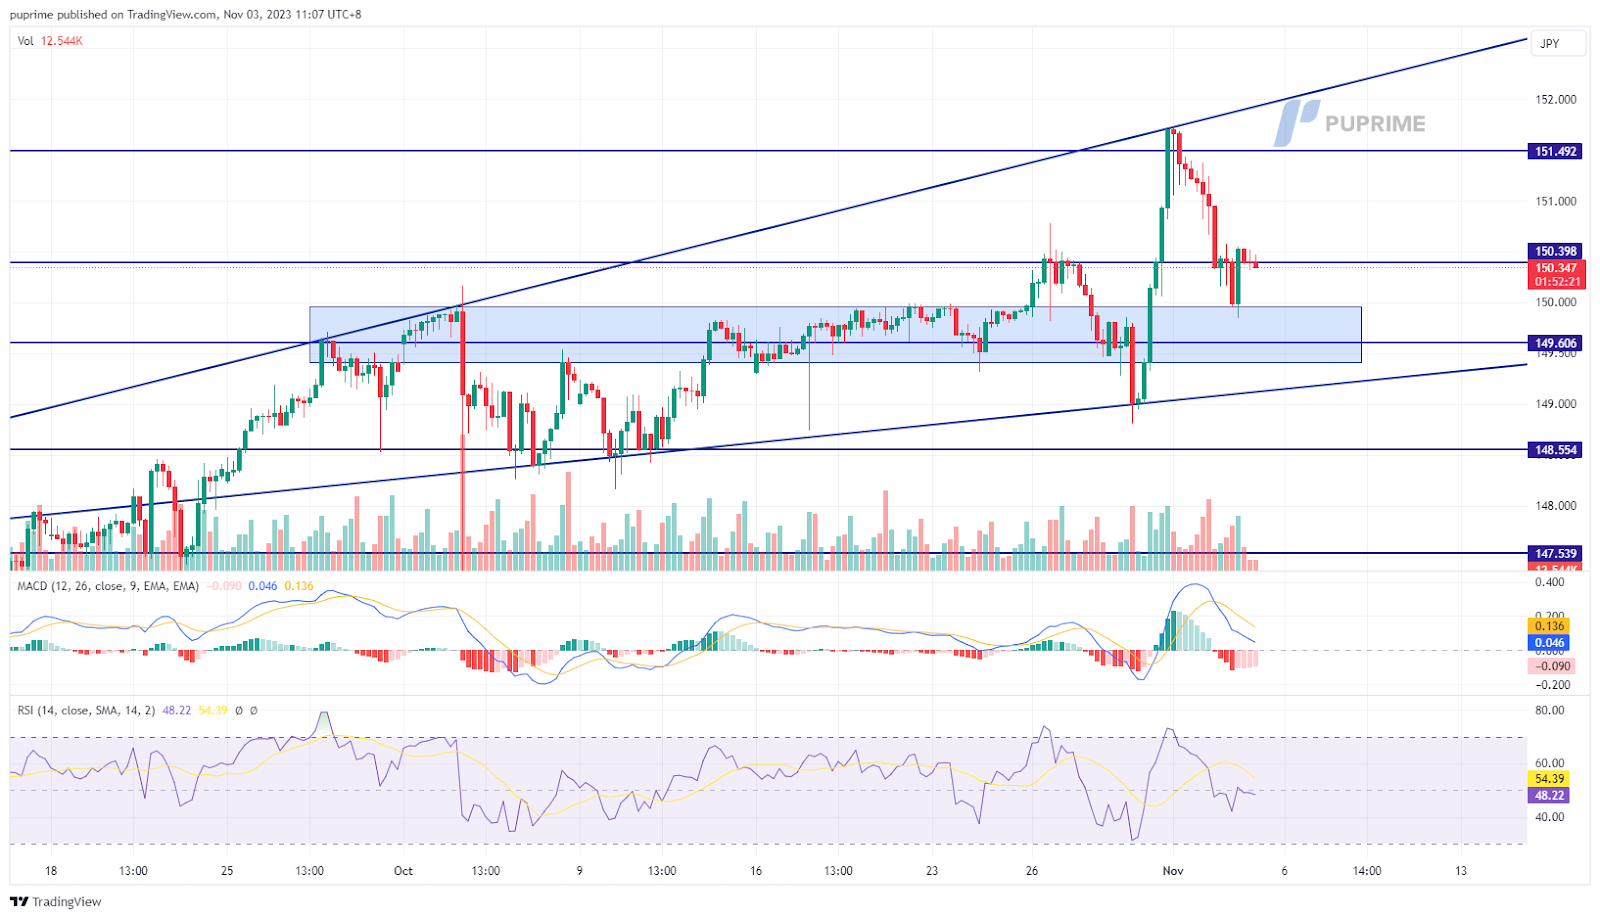
The USD/JPY pair continued its retreat from last October’s highs, driven by the dollar’s weakening. Disappointing U.S. job data reduced chances of a December Fed rate hike amid signs of easing inflation. Despite this, the Japanese Yen struggled due to the Bank of Japan’s dovish stance and negative interest rate policy and the USD/JPY pair is still trading at above 150 trajectory.
USD/JPY retreated drastically from the above and is approaching its crucial liquidity zone. The RSI has edged lower while the MACD has crossed and dropped to near the zero line, suggesting that bearish momentum is forming.
Resistance level:151.55, 152.00
Support level: 149.60, 148.55
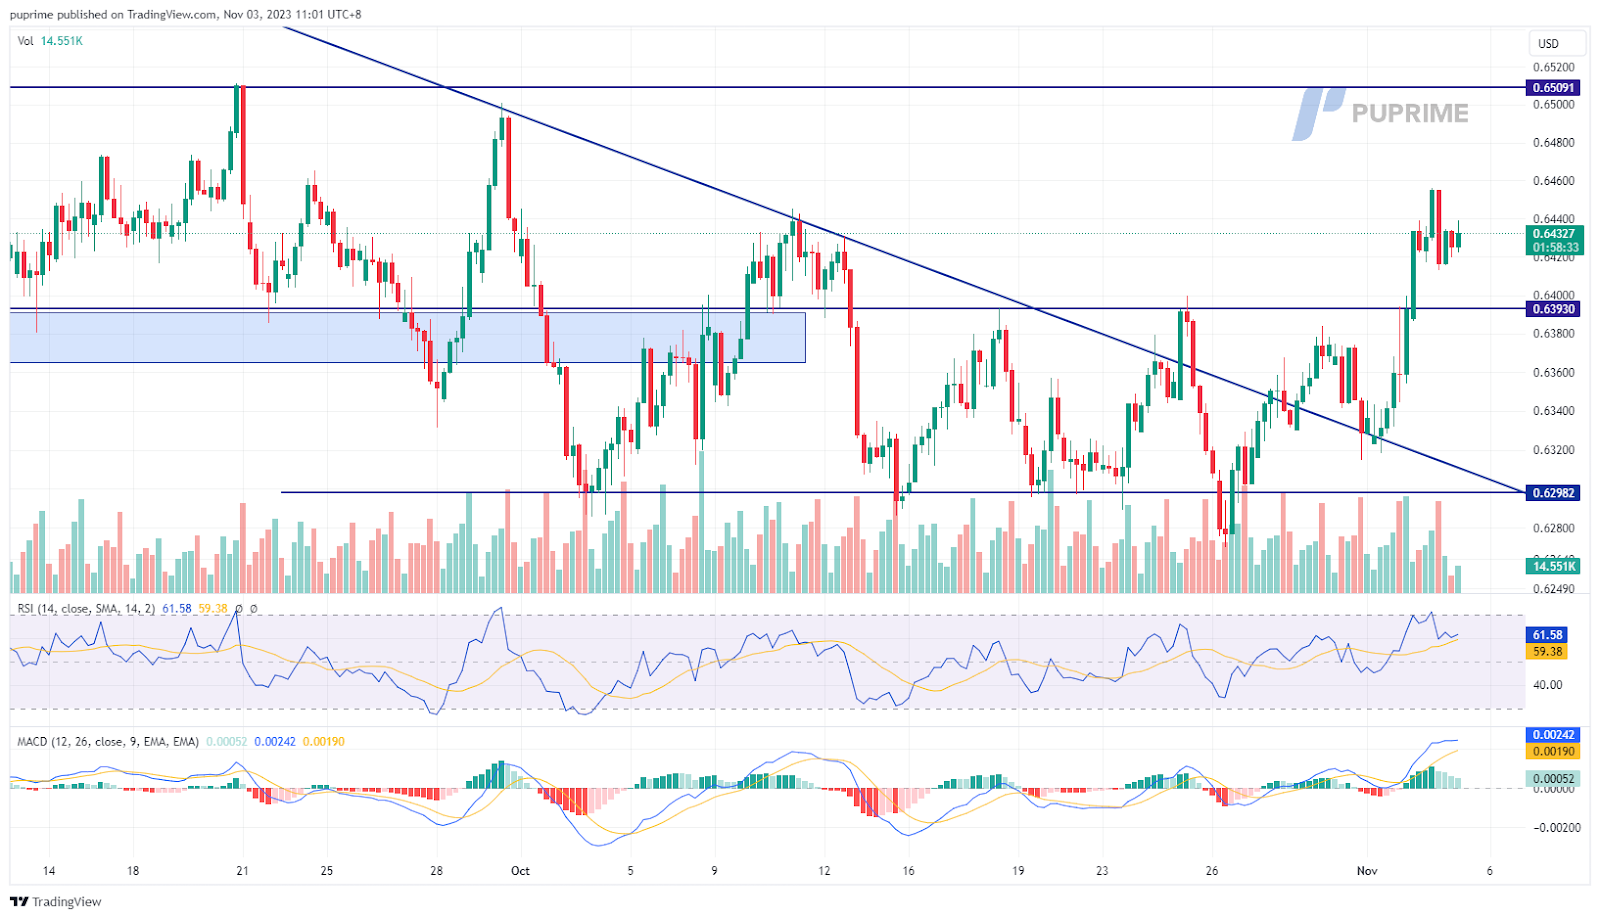
The AUD/USD pair surged, breaking its downtrend resistance, indicating robust bullish momentum. Recent positive Australian economic data fueled speculation of a potential RBA rate hike, supported by the bank’s data-driven approach. In contrast, the U.S. dollar weakened due to disappointing job data and reduced safe-haven demand amid easing Middle East tensions.
The AUD/USD pair rebounded sharply from above its then resistance level, signaling a bullish trend. The RSI is on the brink of breaking into the overbought zone while the MACD continue to climb suggesting the bullish momentum is strong.
Resistance level: 0.6510, 0.6620
Support level: 0.6400, 0.6300
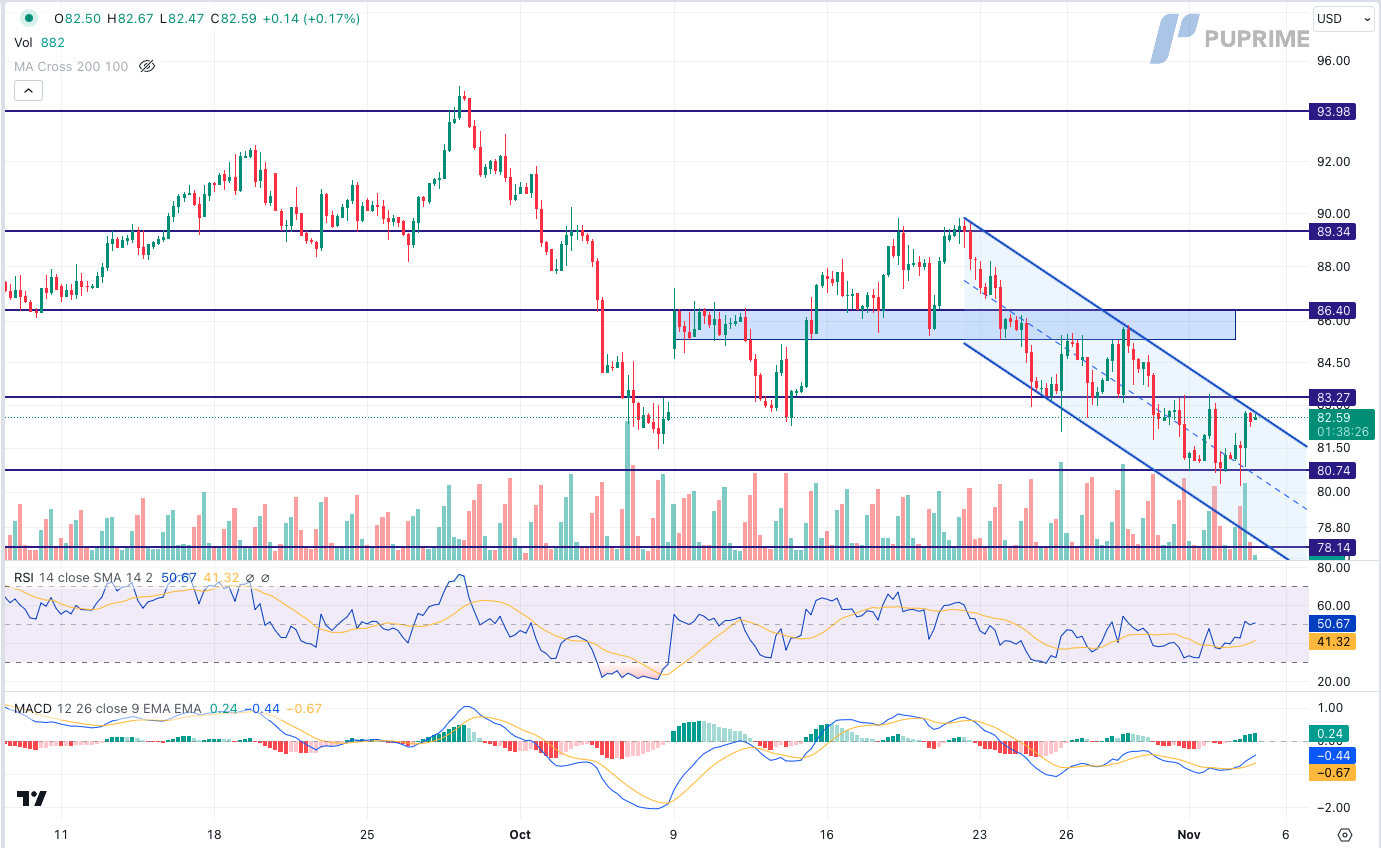
With both the Bank of England and the Federal Reserve opting to maintain their interest rates unchanged, the possibility of an end to the tightening monetary cycle has rekindled a slight recovery in oil prices. Increased risk appetite and a weakened US Dollar have further fuelled demand for dollar-denominated oil. Moving forward, market participants are closely monitoring developments in the Middle East for potential market cues.
Oil prices are trading higher while currently testing the resistance level. MACD has illustrated increasing bullish momentum, while RSI is at 51, suggesting the commodity might extend its gains after breakout since the RSI rebounded sharply from oversold territory.
Resistance level: 83.25, 86.40
Support level: 80.75, 78.15
Step into the world of trading with confidence today. Open a free PU Prime live CFD trading account now to experience real-time market action, or refine your strategies risk-free with our demo account.
This content is for educational and informational purposes only and should not be considered investment advice, a personal recommendation, or an offer to buy or sell any financial instruments.
This material has been prepared without considering any individual investment objectives, financial situations. Any references to past performance of a financial instrument, index, or investment product are not indicative of future results.
PU Prime makes no representation as to the accuracy or completeness of this content and accepts no liability for any loss or damage arising from reliance on the information provided. Trading involves risk, and you should carefully consider your investment objectives and risk tolerance before making any trading decisions. Never invest more than you can afford to lose.

Trade forex, indices, metal, and more at industry-low spreads and lightning-fast execution.
Sign up for a PU Prime Live Account with our hassle-free process.
Effortlessly fund your account with a wide range of channels and accepted currencies.
Access hundreds of instruments under market-leading trading conditions.
Trading Platforms
Learn
About PU Prime
Corporate

Please note the Website is intended for individuals residing in jurisdictions where accessing the Website is permitted by law.
Please note that PU Prime and its affiliated entities are neither established nor operating in your home jurisdiction.
By clicking the "Acknowledge" button, you confirm that you are entering this website solely based on your initiative and not as a result of any specific marketing outreach. You wish to obtain information from this website which is provided on reverse solicitation in accordance with the laws of your home jurisdiction.
Thank You for Your Acknowledgement!
Ten en cuenta que el sitio web está destinado a personas que residen en jurisdicciones donde el acceso al sitio web está permitido por la ley.
Ten en cuenta que PU Prime y sus entidades afiliadas no están establecidas ni operan en tu jurisdicción de origen.
Al hacer clic en el botón "Aceptar", confirmas que estás ingresando a este sitio web por tu propia iniciativa y no como resultado de ningún esfuerzo de marketing específico. Deseas obtener información de este sitio web que se proporciona mediante solicitud inversa de acuerdo con las leyes de tu jurisdicción de origen.
Thank You for Your Acknowledgement!