-
- Trading Platforms
- PU Prime App
- MetaTrader 5
- MetaTrader 4
- PU Copy Trading
- Web Trader
- PU Social
-
- Trading Conditions
- Account Types
- Spreads, Costs & Swaps
- Deposits & Withdrawals
- Fee & Charges
- Trading Hours

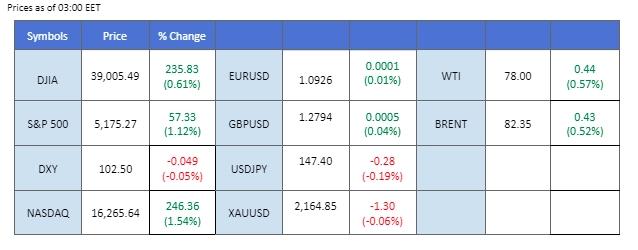
The recent U.S. CPI data, indicating a year-over-year increase of 3.2%, has caused a significant shift in market sentiment, suggesting a more cautious approach by the Federal Reserve towards cutting interest rates. This hinting at a sustained period of economic pressure that could delay the anticipated easing of monetary policy. Interestingly, despite these inflation concerns and the potential for the Fed to maintain high interest rates at their next meeting, the U.S. equity markets responded positively, closing higher with renewed optimism among investors.
In contrast, gold, typically seen as a hedge against inflation and currency devaluation, retreated from its bullish stance, declining by more than 1% in the last session. This pullback could be attributed to the dollar’s strengthening post-CPI announcement, as a stronger dollar makes gold more expensive for holders of other currencies, reducing its appeal. Oil prices remained under the $78 mark, reflecting a cautious stance in the commodities market amid fluctuating demand forecasts and ongoing geopolitical uncertainties.
In Japan, Toyota Motor’s reported willingness to meet wage hike demands fully has fueled speculation around a potential shift in the Bank of Japan’s (BoJ) policy stance. If Japan’s largest automaker is preparing for increased labour costs, it could signal broader economic confidence and inflationary pressures, prompting the BoJ to reconsider its longstanding accommodative monetary policy. The yen’s strong performance in response to these developments highlights market sensitivity to shifts in domestic economic policies and global monetary dynamics.
Current rate hike bets on 20th March Fed interest rate decision:
Source: CME Fedwatch Tool
0 bps (95%) VS -25 bps (5%)

(MT4 System Time)

Source: MQL5

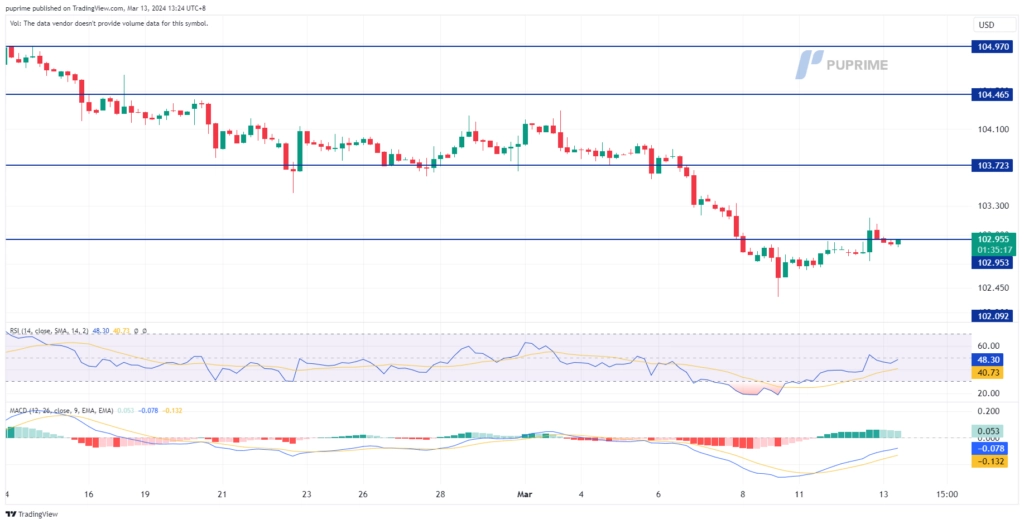
The Dollar Index, consisting of major currencies, surged following the release of robust US inflation data. February’s consumer price growth exceeded expectations, indicating persistent inflationary pressures that could complicate the Federal Reserve’s rate decisions. Headline US consumer prices rose by 3.2% annually, surpassing forecasts of 3.1%, while core CPI data climbed to 3.8%, exceeding economists’ projections at 3.7%, according to the US Bureau of Labor Statistics.
The Dollar Index is trading higher while currently testing the resistance level. MACD has illustrated increasing bullish momentum, while RSI is at 45, suggesting the index might extend its gains after breakout since the RSI rebounded sharply from oversold territory.
Resistance level: 103.05, 103.70
Support level:102.55, 102.10
Gold prices witnessed a significant downturn in response to the upbeat US inflation report and rising US Treasury yields. Concerns about higher interest rates prompted investors to offload non-yield assets such as gold. Concurrently, yields on the 2-year and 10-year Treasury bonds saw slight increases. Investors are advised to monitor additional US economic data releases and Federal Reserve statements for further trading signals.
Gold prices are trading lower while currently testing the support level. MACD has illustrated diminishing bullish momentum, while RSI is at 73, suggesting the commodity might enter overbought territory.
Resistance level: 2235.00, 2350.00
Support level:2150.00, 2080.00
The Pound Sterling has managed to find support at 1.2780 levels, experiencing a modest rebound from its recent bearish trend. However, recent economic data from the UK has presented some challenges for the currency. Yesterday’s release of average earning growth and the unemployment rate fell short of expectations, adding to the pressure on the Sterling. Meanwhile, the Dollar strengthened further as the CPI reading surpassed expectations. Traders are likely to closely monitor the upcoming UK GDP reading scheduled for today. This data will provide insights into the overall economic conditions in the country, potentially influencing the strength and direction of the Pound.
GBP/USD has found support from its recent bearish trend at 1.2780 levels, suggesting a potential rebound at these levels. The RSI has declined to near the 50 level, while the MACD approaching the zero line from above suggests the bullish momentum is vanishing.
Resistance level:1.2905, 1.2995
Support level: 1.2780, 1.2710
The EUR/USD pair has showcased resilience, managing to strengthen against the dollar even as the latter saw an upswing in the previous session fueled by a robust CPI reading. The euro’s buoyancy can be largely attributed to a hawkish stance adopted by several members of the European Central Bank (ECB), indicating a reluctance to consider a rate cut in the near term. This position is further supported by recent regional economic data surpassing expectations, suggesting that the ECB’s tightening monetary policy could persist for extended periods. This scenario highlights the euro’s strength amidst signals of the ECB’s more cautious and prolonged approach to monetary tightening.
EUR/USD has eased from its bullish trend but remains in an uptrend trajectory. The MACD has declined and is approaching the zero line, while the RSI is also moving lower toward the 50 level, suggesting that the bullish momentum is drastically easing.
Resistance level: 1.0955, 1.1040
Support level: 1.0865, 1.0775
The Japanese Yen has exhibited resilience, maintaining strength against the lacklustre dollar despite encountering robust resistance around the 147.60 levels. The recent market sentiment shift, coupled with positive developments such as Toyota Motor meeting wage-hike demands in full, has contributed to the renewed strength of the Japanese Yen. The optimistic wage growth scenario in Japan has fueled expectations for a potential monetary policy shift by the Bank of Japan (BoJ), further bolstering the Yen.
The USD/JPY has recorded a technical rebound but has kept below its strong resistance level at near 147.60. The RSI has emerged from the oversold zone, while the MACD has crossed at the bottom, suggesting the bearish momentum has eased.
Resistance level: 147.65, 149.45
Support level: 146.30, 145.00
The Australian dollar, while experiencing a slight retreat from its recent bullish momentum against the U.S. dollar, continues to follow an upward trajectory in the AUD/USD pair. Traders are carefully positioning themselves ahead of the Reserve Bank of Australia (RBA) interest rate decision scheduled for next week. Market expectations lean towards the RBA adopting a relatively hawkish stance, considering Australia’s high inflation rate and stable GDP growth.
The AUD/USD pair has found support and traded sideways after easing slightly from its recent peak. The RSI remains flowing in the upper region while the MACD continues to decline and is approaching the zero line, suggesting the bullish momentum is easing.
Resistance level: 0.6617, 0.6660
Support level: 0.6560, 0.6535
Despite worries about inflation driving up US Treasury yields, the US equity market experienced a sharp uptick. Investors focused on positive news from Oracle, the third-largest software company globally. Oracle’s shares surged by 11.7% to a record high after reporting upbeat quarterly results and announcing a collaboration with Nvidia (NASDAQ:NVDA), a leading artificial intelligence chip giant. Nvidia’s shares also rose by 7.2%, contributing to the rally in semiconductor stocks, bolstered by ongoing AI trends.
The Dow is trading higher while currently testing the resistance level. MACD has illustrated diminishing bearish momentum, while RSI is at 58, suggesting the index might extend its gains after breakout since the RSI stays above the midline.
Resistance level: 39400.00, 40000.00
Support level: 37915.00, 36735.00
Oil prices exhibited relative stability amid mixed market sentiment. The US Energy Information Administration (EIA) revised its 2024 domestic oil output growth forecast higher, indicating potentially increased supply levels. Conversely, OPEC maintained its forecast for robust global oil demand growth in 2024 and 2025, alongside an upward revision in its economic growth forecast. These contrasting forecasts add complexity to the oil market outlook, prompting investors to closely monitor developments for trading signals.
Oil prices are holding steady as they approach a key resistance level, but with MACD and RSI indicators hovering near the midline, the market lacks significant catalysts for a breakout. This suggests that the commodity is likely to remain range-bound and consolidate for the time being.
Resistance level: 78.00, 80.20
Support level: 75.95, 73.45
Step into the world of trading with confidence today. Open a free PU Prime live CFD trading account now to experience real-time market action, or refine your strategies risk-free with our demo account.
This content is for educational and informational purposes only and should not be considered investment advice, a personal recommendation, or an offer to buy or sell any financial instruments.
This material has been prepared without considering any individual investment objectives, financial situations. Any references to past performance of a financial instrument, index, or investment product are not indicative of future results.
PU Prime makes no representation as to the accuracy or completeness of this content and accepts no liability for any loss or damage arising from reliance on the information provided. Trading involves risk, and you should carefully consider your investment objectives and risk tolerance before making any trading decisions. Never invest more than you can afford to lose.

Trade forex, indices, metal, and more at industry-low spreads and lightning-fast execution.
Sign up for a PU Prime Live Account with our hassle-free process.
Effortlessly fund your account with a wide range of channels and accepted currencies.
Access hundreds of instruments under market-leading trading conditions.
Please note the Website is intended for individuals residing in jurisdictions where accessing the Website is permitted by law.
Please note that PU Prime and its affiliated entities are neither established nor operating in your home jurisdiction.
By clicking the "Acknowledge" button, you confirm that you are entering this website solely based on your initiative and not as a result of any specific marketing outreach. You wish to obtain information from this website which is provided on reverse solicitation in accordance with the laws of your home jurisdiction.
Thank You for Your Acknowledgement!
Ten en cuenta que el sitio web está destinado a personas que residen en jurisdicciones donde el acceso al sitio web está permitido por la ley.
Ten en cuenta que PU Prime y sus entidades afiliadas no están establecidas ni operan en tu jurisdicción de origen.
Al hacer clic en el botón "Aceptar", confirmas que estás ingresando a este sitio web por tu propia iniciativa y no como resultado de ningún esfuerzo de marketing específico. Deseas obtener información de este sitio web que se proporciona mediante solicitud inversa de acuerdo con las leyes de tu jurisdicción de origen.
Thank You for Your Acknowledgement!