-
- Trading Platforms
- PU Prime App
- MetaTrader 5
- MetaTrader 4
- PU Copy Trading
- Web Trader
- PU Social
-
- Trading Conditions
- Account Types
- Spreads, Costs & Swaps
- Deposits & Withdrawals
- Fee & Charges
- Trading Hours

Both President Biden and House Speaker Kevin McCarthy struck an optimistic tone regarding the prospects of reaching a consensus to raise the national debt ceiling and avert a potentially catastrophic default on the debt. As a result, gold prices experienced a downward slide, falling below the $2000 mark, reflecting the easing concerns surrounding the debt crisis. However, McCarthy acknowledged that significant work lies ahead and finalising an agreement remains a challenging task. On the other hand, Japan reported a GDP that surpassed expectations, which has heightened speculation that the Bank of Japan may consider making adjustments or even ending its Yield Curve Control (YCC) policy. Elsewhere, oil prices traded in a narrow range concerning China’s slower-than-expected recovery despite positive indicators from the International Energy Agency (IEA) and encouraging data from the United States.
Current rate hike bets on 14th June Fed interest rate decision:
Source: CME Fedwatch Tool
0 bps (83%) VS 25 bps (17%)


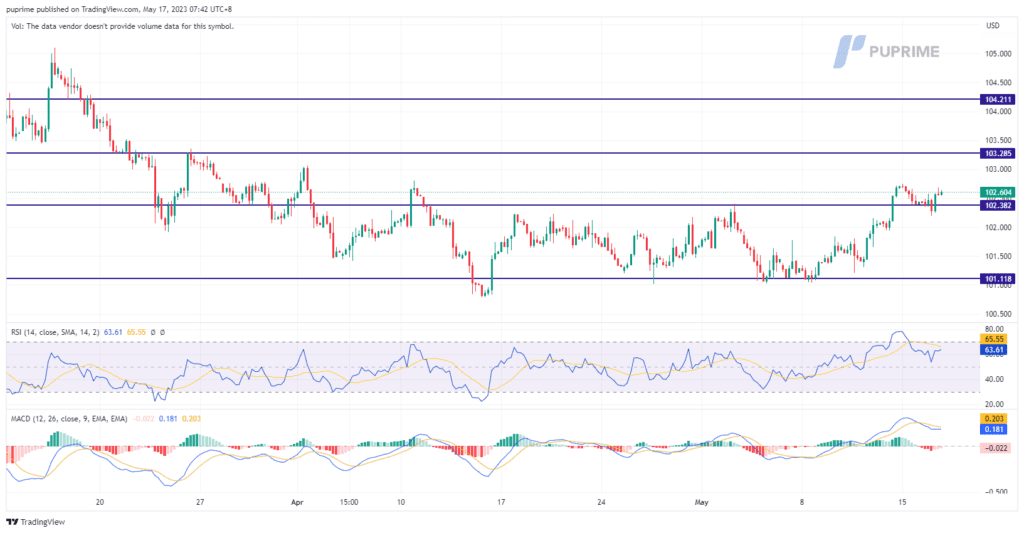
The US dollar strengthened as optimism grew regarding the ongoing debt ceiling talks. Market participants hoped that a bipartisan agreement to raise the debt ceiling could be reached, fueling positive sentiment and bolstering the currency’s value. The negotiations between President Joe Biden and congressional leaders indicated a willingness to avoid a potential default on US debts. The optimistic outlook surrounding these talks supported the US dollar against other major currencies. Investors closely monitored the progress of the discussions, as a successful resolution could have far-reaching implications for financial markets and the overall economic stability of the United States.
The US dollar continues to exhibit strength in the market, trading above the key resistance level of $102.382. This sustained performance suggests a positive outlook for the currency. Technical indicators such as the MACD and the RSI further support the bullish sentiment, indicating the potential for continued upward momentum.
Resistance level: 103.30, 104.20
Support level: 102.40, 100.10
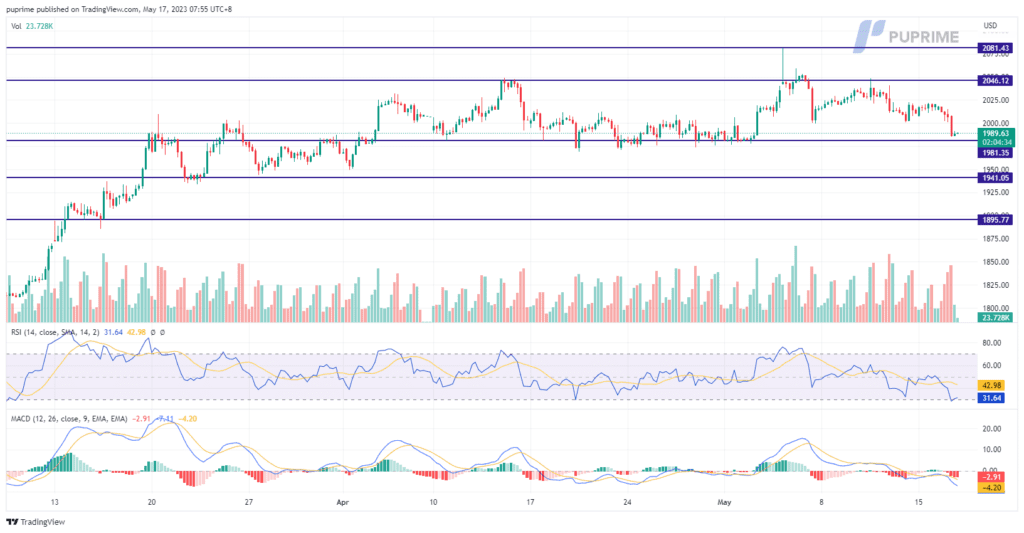
Gold prices experienced a significant decline of 1.58% as they dropped below the $2000 mark. This downward movement can be attributed to the diminished concerns surrounding the debt ceiling issue. As the dollar strengthened, it exerted additional pressure on gold, weakening prices. The reduced anxiety surrounding the debt ceiling negotiations eased investors’ appetite for safe-haven assets like gold. The strengthened dollar, which often moves inversely to gold, further contributed to the decline. Traders and market participants closely monitor these developments, analyzing the impact of the debt ceiling situation and the dollar’s strength on gold prices.
Gold prices experienced a significant shift in momentum as they dropped below the key psychological level of $2000. This development signals a notable trend change, with the market transitioning into a bearish phase.
Resistance level: 2045.00, 2080.00
Support level: 1980.00, 1940.00
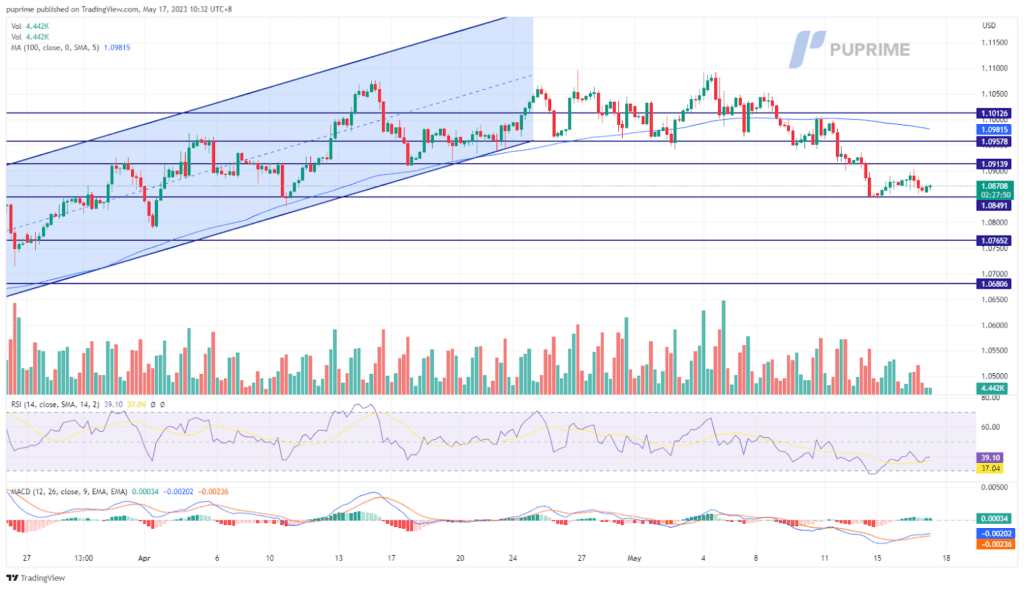
After successfully rebounding above the crucial support level at 1.0850, the euro was hammered by the strengthened dollar, which almost wiped up its previous gain. The dollar was supported by positive U.S. economic data with the retail sales rose by 0.4% from -0.7% and industrial production rose by 0.5% from 0%. Besides, the dollar was also encouraged by the news that President Biden and the House Speaker have a progressive meeting over raising the debt ceiling to avert the catastrophic event from happening.
The euro continued to trade in its bearish channel in May. The RSI and the MACD continue to flow flat given a neutral-bearish signal for the pair.
Resistance level: 1.0914, 1.0958
Support level: 1.0765, 1.0681
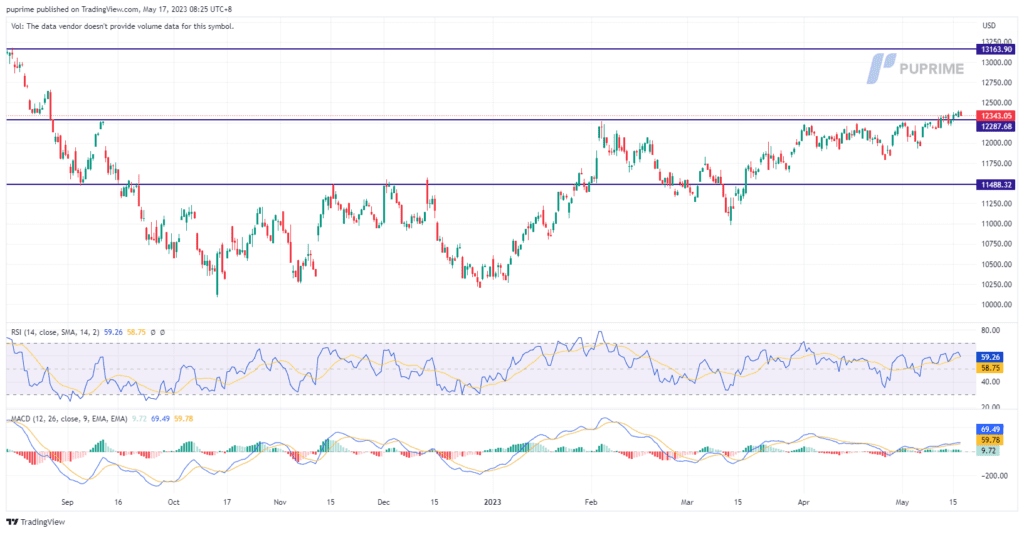
The Nasdaq Composite closed lower on Tuesday, weighed down by factors including mixed economic data, disappointing corporate results, and ongoing debt ceiling negotiations in Washington. These factors collectively dampened investor risk appetite, resulting in a decline in the tech-heavy index. However, the losses were partially offset by the strength of momentum mega-caps such as Amazon.com, Alphabet Inc, and Microsoft Corp. Market participants closely monitor the progress of the debt ceiling negotiations and analyse the impact of economic data on future market trends.
The overall outlook for the Nasdaq remains positive as the index continues to trade above a significant support level. Market analysts closely monitor whether the index can sustain its position above this level, indicating a potential continuation of the positive trend. Investors are advised to keep a close eye on market developments and monitor key indicators to gauge the sustainability of the Nasdaq’s performance.
Resistance level: 13163, 14163
Support level: 12287, 11488
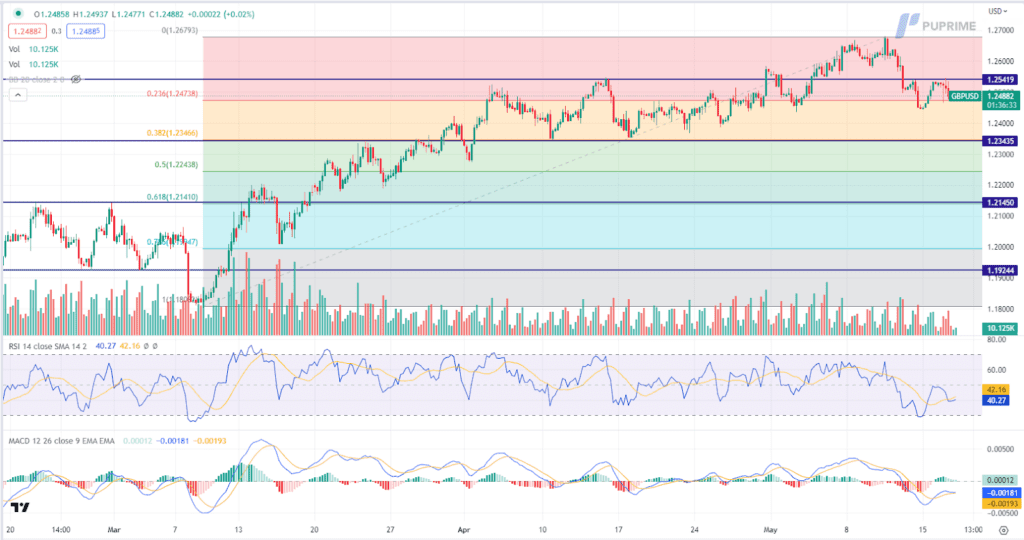
The Pound Sterling suffered a significant decline as discouraging economic data emerged, with the UK Claimant Count Change figures worsening beyond market expectations. The Office for National Statistics’ report highlighted the alarming state of the labour market, as the surge from 26.5K to 46.7K in the claimant count change unveiled a bleaker employment scenario than anticipated.
GBP/USD is trading lower following the prior retracement from the resistance level. MACD has illustrated diminishing bullish momentum, while RSI is at 40, suggesting the pair might extend its losses toward support level as the RSI stays below the midline.
Resistance level: 1.2540, 1.2680
Support level: 1.2345, 1.2145
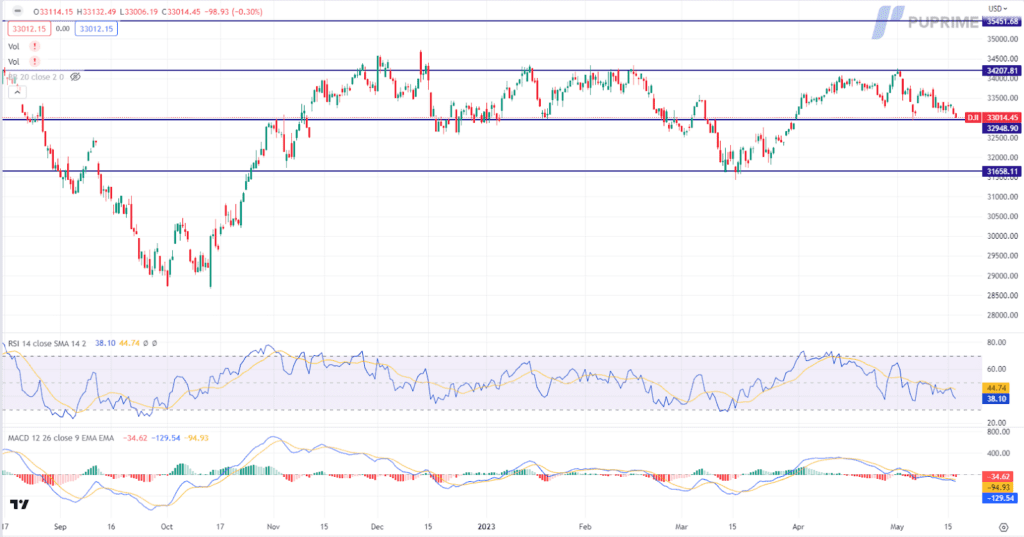
The Dow Jones Industrial Average encountered significant headwinds as lacklustre U.S. retail sales figures fell short of market expectations, resulting in a drop of over 150 points. Adding to the market’s concerns, Home Depot’s revenue miss further intensified the sell-off. April’s retail sales registered a modest increase of 0.4%, below Wall Street’s projections of a stronger 0.7% rise, highlighting potential challenges in consumer spending. The underwhelming data underscored the importance of retail sales as a vital indicator of economic growth and investor sentiment, leading to a broader market sell-off and increased caution among market participants.
The Dow is trading lower while currently near the support level. MACD has illustrated increasing bearish momentum, while RSI is at 45, suggesting the index might extend its losses after breakout since the RSI stays below the midline.
Resistance level: 34210, 35450
Support level: 32950, 31660
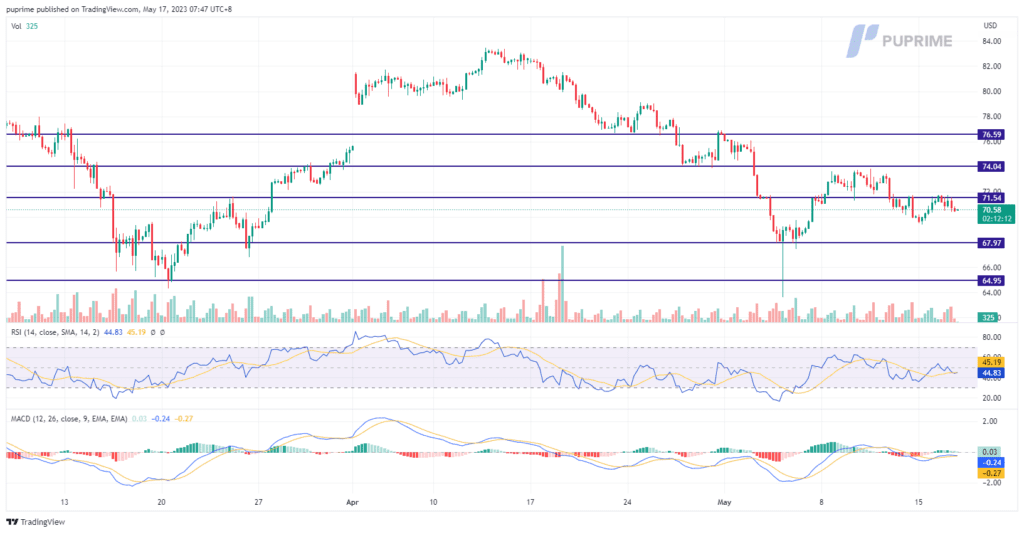
Oil prices dipped due to concerns over China’s slowing industrial output, which hinted at a loss of momentum for the oil-consuming giant. Additionally, the API reported excess weekly crude oil stocks, further pressuring prices. However, a positive note came from the International Energy Agency’s revised global demand outlook, which increased by 200,000 barrels per day. Despite this, the weaker demand outlook from China overshadowed the positive indicators, dampening market sentiment.
Oil prices edged lower, indicating a sluggish continuation of the bearish momentum. Technical indicators, MACD and RSI, confirm the prevailing bearish sentiment in the market. While the market remains in a bearish state, the pace of the downward movement suggests a cautious and measured decline rather than a rapid plummet.
Resistance level: 71.55, 74.05
Support level: 67.95, 64.95
Step into the world of trading with confidence today. Open a free PU Prime live CFD trading account now to experience real-time market action, or refine your strategies risk-free with our demo account.
This content is for educational and informational purposes only and should not be considered investment advice, a personal recommendation, or an offer to buy or sell any financial instruments.
This material has been prepared without considering any individual investment objectives, financial situations. Any references to past performance of a financial instrument, index, or investment product are not indicative of future results.
PU Prime makes no representation as to the accuracy or completeness of this content and accepts no liability for any loss or damage arising from reliance on the information provided. Trading involves risk, and you should carefully consider your investment objectives and risk tolerance before making any trading decisions. Never invest more than you can afford to lose.

Trade forex, indices, metal, and more at industry-low spreads and lightning-fast execution.
Sign up for a PU Prime Live Account with our hassle-free process.
Effortlessly fund your account with a wide range of channels and accepted currencies.
Access hundreds of instruments under market-leading trading conditions.
Please note the Website is intended for individuals residing in jurisdictions where accessing the Website is permitted by law.
Please note that PU Prime and its affiliated entities are neither established nor operating in your home jurisdiction.
By clicking the "Acknowledge" button, you confirm that you are entering this website solely based on your initiative and not as a result of any specific marketing outreach. You wish to obtain information from this website which is provided on reverse solicitation in accordance with the laws of your home jurisdiction.
Thank You for Your Acknowledgement!
Ten en cuenta que el sitio web está destinado a personas que residen en jurisdicciones donde el acceso al sitio web está permitido por la ley.
Ten en cuenta que PU Prime y sus entidades afiliadas no están establecidas ni operan en tu jurisdicción de origen.
Al hacer clic en el botón "Aceptar", confirmas que estás ingresando a este sitio web por tu propia iniciativa y no como resultado de ningún esfuerzo de marketing específico. Deseas obtener información de este sitio web que se proporciona mediante solicitud inversa de acuerdo con las leyes de tu jurisdicción de origen.
Thank You for Your Acknowledgement!