-
- Trading Platforms
- PU Prime App
- MetaTrader 5
- MetaTrader 4
- PU Copy Trading
- Web Trader
- PU Social
-
- Trading Conditions
- Account Types
- Spreads, Costs & Swaps
- Deposits & Withdrawals
- Fee & Charges
- Trading Hours

US Treasury Secretary Janet Yellen has once again emphasised the need to pass the debt ceiling bill before June 1, warning that failure to do so could result in the federal government running out of cash to meet its obligations. President Biden is set to hold a meeting with congressional leaders today to reach a consensus on the issue. A failure to do so could have catastrophic consequences especially for the US dollar and gold, as the country has never before defaulted on its obligations. Meanwhile, consumer confidence in Australia has taken a hit following the government’s announcement of a budget surplus, which has slightly impacted the Australian dollar in Asian morning trading. In the energy market, the Canada wildfire has disrupted the supply of 500,000 barrels of oil per day, leading to tighter supply. However, concerns over a global economic slowdown have kept oil prices trading lower.
Current rate hike bets on 14th June Fed interest rate decision:
Source: CME Fedwatch Tool
0 bps (81%) VS 25 bps (19%)
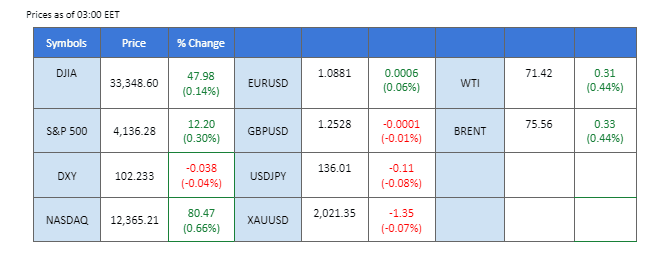
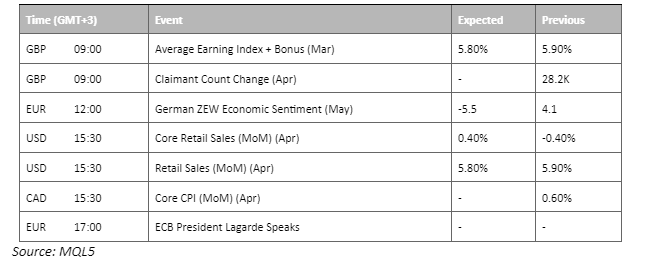

The safe-haven Dollar retreated slightly amid bearish economic data from the US region and improving risk appetite, which stoked a shift in sentiment toward other riskier assets. The New York Federal Reserve’s Empire State Index, a reliable gauge of manufacturing activity in New York State, delivered a disappointing reading in May. The index tumbled to -31.8, significantly missing market expectations of -3.75. This unexpected downturn in manufacturing activity raised concerns about the overall health of the economy, prompting investors to reassess their positions.
The Dollar Index is trading lower while currently testing the support level. MACD has illustrated increasing bearish momentum, while RSI is at 62, suggesting the index might extend its losses after breakout as the RSI retreated sharply from overbought territory.
Resistance level: 103.30, 104.20
Support level: 102.40, 100.10

Safe-haven gold experienced a retreat as investors cautiously embraced a flicker of optimism surrounding the possibility of policymakers in Washington transcending partisan wrangling and achieving a crucial debt ceiling agreement. The trajectory of gold prices remained closely intertwined with developments in the debt ceiling negotiations, as investors eagerly monitored the progress for further trading cues and potential shifts in market sentiment.
Gold prices are trading lower following the prior retracement from the resistance level. MACD has illustrated diminishing bullish momentum while RSI is at 46, suggesting the commodity might extend its losses toward support level.
Resistance level: 2045.00, 2080.00
Support level: 1980.00, 1940.00
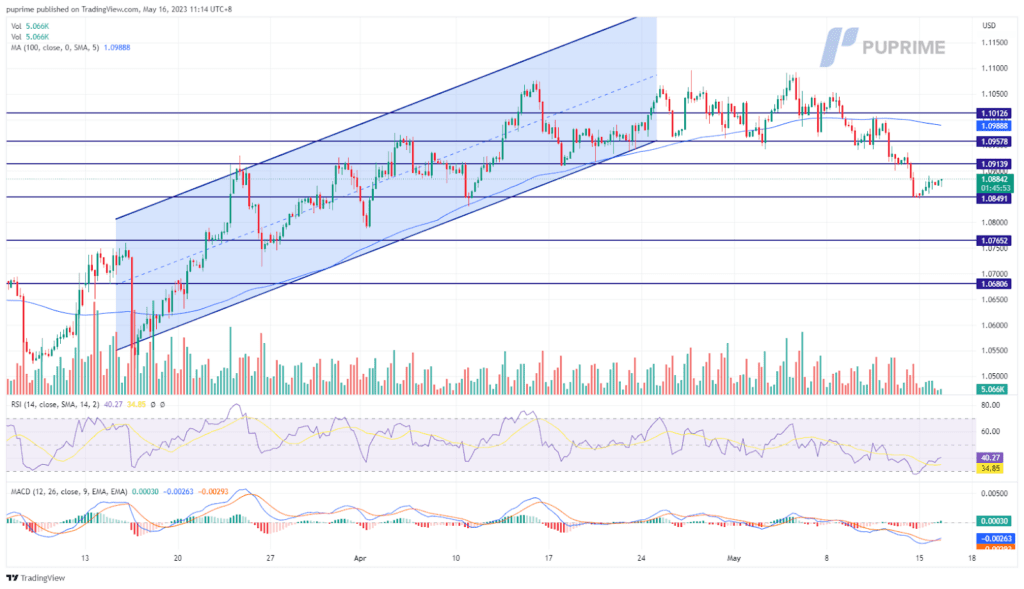
The dollar rose strongly and hit its highest in May before it retraced and led to a slight rebound for the euro. The weaker-than-expected economic data for the economic bloc has dragged the euro to trade lower against the strengthened dollar. The eurozone industrial production came at -4.1%, down from the previous reading of 1.5% and also lower than the market consensus of -2.5%, reflecting the economy in the region is not optimistic. In addition, President Biden is holding a meeting to discuss the debt ceiling bill with the congressional leader today; the outcome may have a huge impact on the dollar as well.
The euro rebounded on a crucial support level at 1.0850 after several support levels had been broken in May. The RSI has rebounded before get into the oversold zone while the MACD has signs of rebound suggesting the pair might be welcoming a trend reversal.
Resistance level: 1.0914, 1.0958
Support level: 1.0765, 1.0681
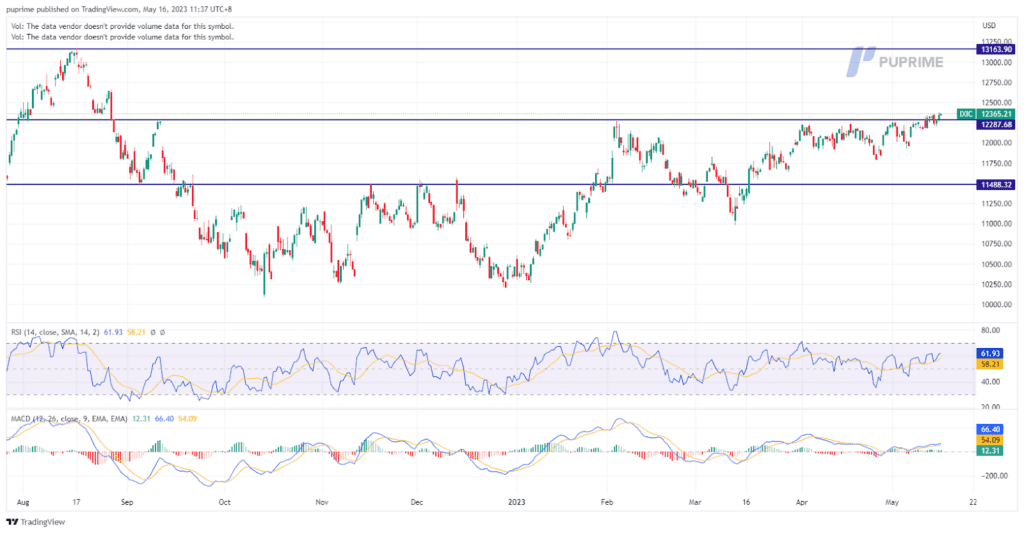
The Nasdaq Composite experienced a notable upswing, gaining 80.47 points or 0.66%, closing at 12,365.21. As investors searched for key market drivers, their attention turned to the ongoing negotiations between President Joe Biden and House Republicans, a critical topic just weeks away from the potential risk of a U.S. government default on its debts. Joseph Sroka, the Chief Investment Officer at NovaPoint in Atlanta, highlighted a sense of optimism surrounding discussions on the debt ceiling. While some scepticism exists due to potential political manoeuvres, this positive sentiment has boosted the market’s daily performance. Investors closely monitor these negotiations as they navigate the potential impact on the market.
The Nasdaq Composite has made a significant breakthrough by surpassing its resistance level at 12,287, signalling a shift towards a bullish trend. This milestone comes as both the MACD and the RSI further reinforce the positive sentiment.
Resistance level: 13163, 14163
Support level: 12287, 11488
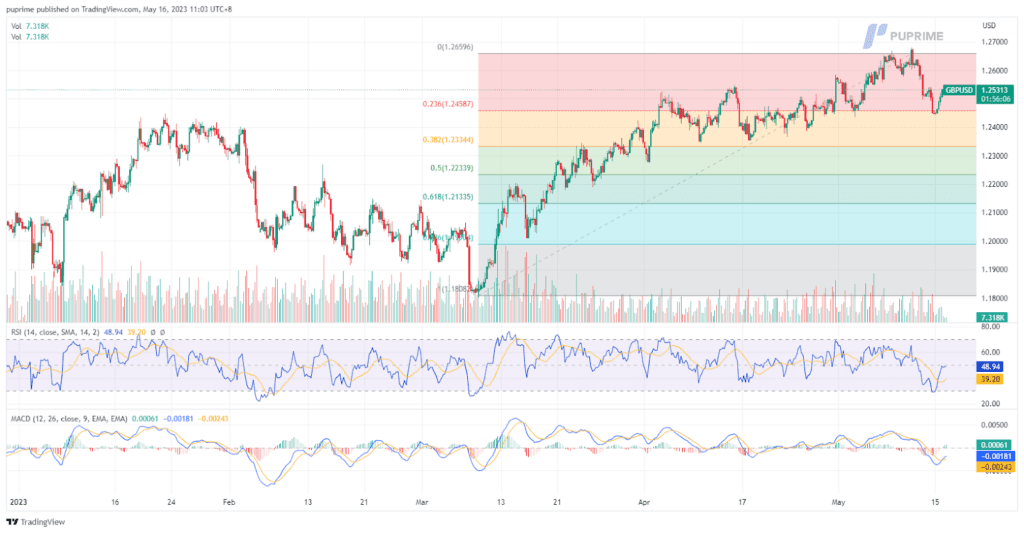
In a notable turn of events, the British pound has once again picked up its bullish momentum, reaching a value of $1.2531 at the time of writing. This surge can be attributed to a weakened U.S. dollar, which has supported the pound’s upward trajectory. Traders and investors eagerly await the release of the upcoming job report economic data, scheduled to be disclosed later today. Crucial data release will provide further insight into the economic landscape, potentially influencing market sentiment and shaping future trading decisions. As anticipation mounts, market participants remain attentive to the outcomes of this significant economic update.
The MACD displays diminishing downward pressure, suggesting a potential reversal in the prevailing trend. Concurrently, the RSI stands at the neutral level of 50, indicating a balanced market sentiment with a slight inclination towards bullish momentum.
Resistance level: 1.2679, 1.2892
Support level: 1.2473, 1.2346
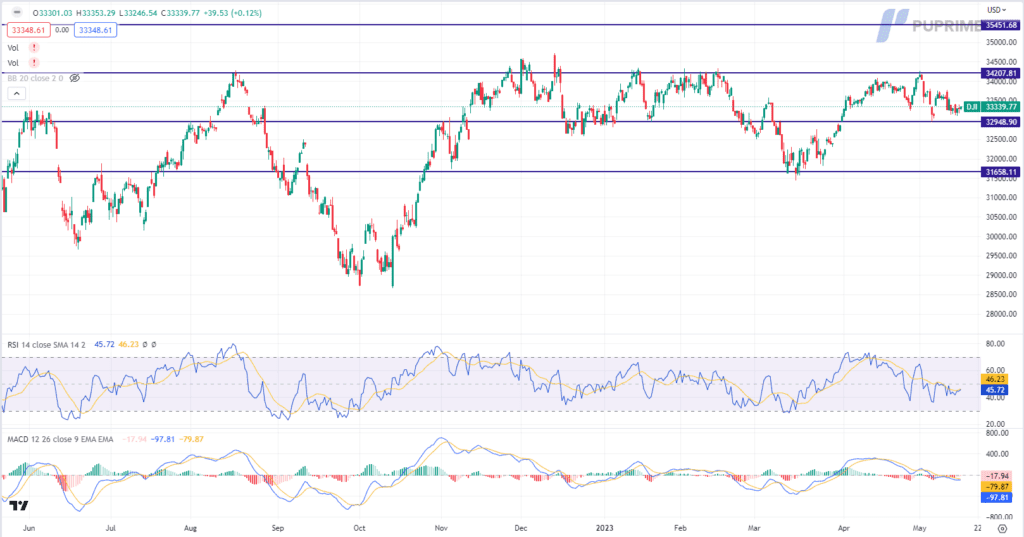
The Dow edged higher amidst flickering optimism that policymakers in Washington would overcome partisan wrangling and reach a much-needed debt ceiling deal. This development boosted risk appetite in the global financial market, as investors sought to capitalise on the potential resolution of the political deadlock. While political dynamics took centre stage, regional banks emerged as a key focus, rebounding from a recent selloff. Investors regained confidence in the banking sector after carefully digesting the previous banking turmoil, contributing to the renewed interest and upward momentum in these institutions.
The Dow is trading lower while currently near the support level. MACD has illustrated increasing bearish momentum, while RSI is at 45, suggesting the index might extend its losses after breakout since the RSI stays below the midline.
Resistance level: 34210, 35450
Support level: 32950, 31660

Oil prices rebounded following three consecutive sessions of decline. The surge was fuelled by concerns over tightening supplies in Canada and other regions. Wildfires ravaged Alberta, Canada, resulting in the shutdown of significant crude supply, leading to fears of exacerbation. Robert Yawger, an analyst at Mizuho, highlighted the potential for worsening conditions due to the wildfires. Last week alone, approximately 300,000 barrels of oil equivalent per day (bpd) production were halted in Alberta, recalling memories of the 2016 wildfires that knocked offline over a million bpd of production.
Oil prices are trading higher while currently testing the resistance level. MACD has illustrated increasing bullish momentum, while RSI is at 50, suggesting the commodity might extend its gains after breakout since the RSI rebound sharply from oversold territory.
Resistance level: 71.55, 74.05
Support level: 67.95, 64.95
Step into the world of trading with confidence today. Open a free PU Prime live CFD trading account now to experience real-time market action, or refine your strategies risk-free with our demo account.
This content is for educational and informational purposes only and should not be considered investment advice, a personal recommendation, or an offer to buy or sell any financial instruments.
This material has been prepared without considering any individual investment objectives, financial situations. Any references to past performance of a financial instrument, index, or investment product are not indicative of future results.
PU Prime makes no representation as to the accuracy or completeness of this content and accepts no liability for any loss or damage arising from reliance on the information provided. Trading involves risk, and you should carefully consider your investment objectives and risk tolerance before making any trading decisions. Never invest more than you can afford to lose.

Trade forex, indices, metal, and more at industry-low spreads and lightning-fast execution.
Sign up for a PU Prime Live Account with our hassle-free process.
Effortlessly fund your account with a wide range of channels and accepted currencies.
Access hundreds of instruments under market-leading trading conditions.
Please note the Website is intended for individuals residing in jurisdictions where accessing the Website is permitted by law.
Please note that PU Prime and its affiliated entities are neither established nor operating in your home jurisdiction.
By clicking the "Acknowledge" button, you confirm that you are entering this website solely based on your initiative and not as a result of any specific marketing outreach. You wish to obtain information from this website which is provided on reverse solicitation in accordance with the laws of your home jurisdiction.
Thank You for Your Acknowledgement!
Ten en cuenta que el sitio web está destinado a personas que residen en jurisdicciones donde el acceso al sitio web está permitido por la ley.
Ten en cuenta que PU Prime y sus entidades afiliadas no están establecidas ni operan en tu jurisdicción de origen.
Al hacer clic en el botón "Aceptar", confirmas que estás ingresando a este sitio web por tu propia iniciativa y no como resultado de ningún esfuerzo de marketing específico. Deseas obtener información de este sitio web que se proporciona mediante solicitud inversa de acuerdo con las leyes de tu jurisdicción de origen.
Thank You for Your Acknowledgement!