


-
- Trading Platforms
- PU Prime App
- MetaTrader 5
- MetaTrader 4
- PU Copy Trading
- Web Trader
- PU Social
-
- Trading Conditions
- Account Types
- Spreads, Costs & Swaps
- Deposits & Withdrawals
- Fee & Charges
- Trading Hours


EN
12 October 2023,05:42
Daily Market Analysis
12 October 2023, 05:42


The dollar struggles below the $106 mark as the Federal Reserve adopts a dovish stance, signalling a potential end to its rate-hiking cycle. Despite a stronger-than-expected U.S. Producer Price Index (PPI), the dollar remains subdued due to the Fed’s balanced assessment of inflation and recession risks, revealed in the September Federal Open Market Committee (FOMC) meeting minutes. Gold prices surged on the back of the dollar’s softened position and ongoing geopolitical tensions in the Middle East. In contrast, oil markets experienced a sharp 3% decline following a substantial increase in crude stockpiles reported by the American Petroleum Institute (API). On top of that, Saudi Arabia’s commitment to stabilising oil prices amid Middle East conflicts tempers the market’s apprehension.
Current rate hike bets on 1st November Fed interest rate decision:
Source: CME Fedwatch Tool
0 bps (88.0%) VS 25 bps (12%)


The US Dollar remained steady as it tested robust support levels, with the US Producer Prices Index revealing a slight drop in underlying inflation, aligning with market expectations. However, the retreat in US Treasury yields, fueled by a chorus of dovish tones from Federal Reserve members, has tempered the need for imminent rate hikes. Investor attention is now keenly focused on the forthcoming US Consumer Price Index (CPI) data for potential market movements.
The Dollar Index is trading lower while currently testing the support level. MACD has illustrated increasing bearish momentum, while RSI is at 36, suggesting the index might enter oversold territory.
Resistance level: 106.35, 106.90
Support level: 105.65, 105.20

As geopolitical tensions in the Middle East continue to rise, investors have sought refuge in safe-haven assets, prompting a surge in the gold market. Gold’s persistent climb above a formidable resistance level is noteworthy, though lingering uncertainties, coupled with critical economic data releases, call for caution when navigating these markets.
Gold prices are trading higher while currently near the resistance level. MACD has illustrated increasing bullish momentum, while RSI is at 48, suggesting the commodity might extend its gains after breakout since the RSI rebounded sharply from oversold territory.
Resistance level: 1875.00, 1930.00
Support level: 1830.00, 1785.00

The euro maintains its upward trajectory against the dollar, capitalising on the greenback’s weakened stance. Despite robust U.S. Producer Price Index (PPI) data, the dollar remains subdued due to the Federal Reserve’s dovish stance, as revealed in the September Federal Open Market Committee (FOMC) meeting minutes. Investors increasingly anticipate a possible rate pause from the Fed in November, contributing to the euro strengthening against the dollar.
The EUR/USD pair continues to trade within the uptrend channel, suggesting the bullish momentum is still intact with the pair. The RSI and the MACD have eased despite continuing to move upward, suggesting the bullish momentum is easing.
Resistance level: 1.0630, 1.0700
Support level: 1.0500, 1.0460
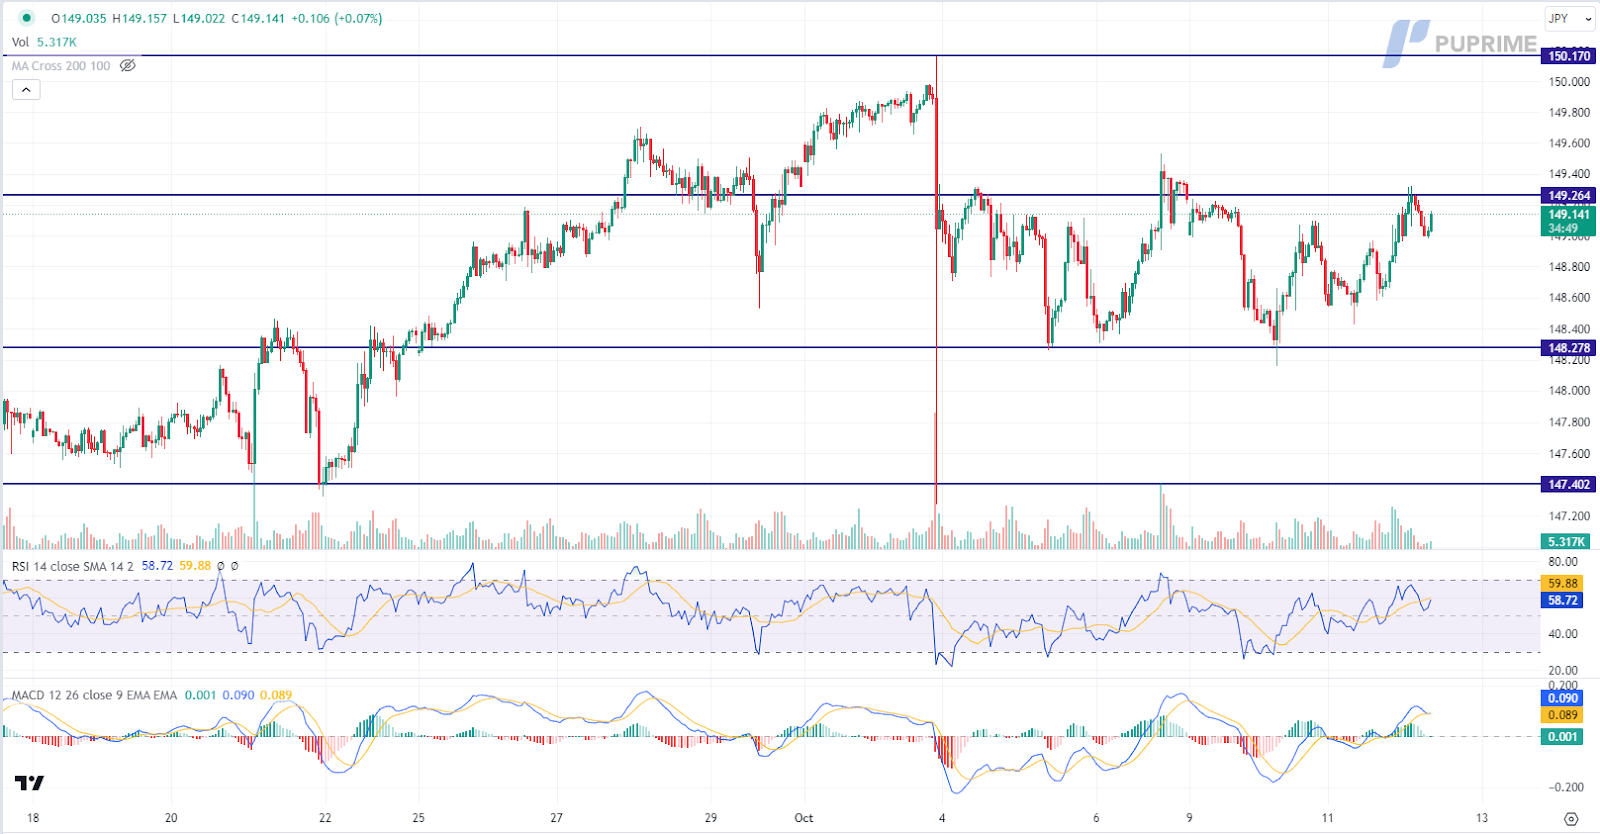
The USD/JPY pair maintained a flat trading pattern ahead of pivotal events. On the Japanese yen front, traders should remain vigilant for potential monetary interventions by the Bank of Japan, offering potential trading signals. Additionally, market volatility for the Japanese yen is anticipated to remain elevated in the lead-up to the release of US inflation data, demanding investors’ vigilant attention.
USD/JPY is trading higher while currently near the resistance level. However, MACD has illustrated diminishing bullish momentum, while RSI is at 58, suggesting the pair might experience technical correction since the RSI retreated sharply from overbought territory.
Resistance level: 149.25, 150.15
Support level: 148.30, 147.40

US equity markets displayed resilience, bolstered by the Federal Reserve’s dovish signals, instilling confidence in rate stability. Falling US Treasury yields, combined with the Federal Reserve’s accommodating stance, are set to fuel the allure of US equities. In the backdrop, benchmark 10-year Treasury yields hit a two-week low, as investors flocked to US Treasury bonds in response to escalating geopolitical crises.
The Dow is trading higher following the prior breakout above the previous resistance level. MACD has illustrated increasing bullish momentum, while RSI is at 55, suggesting the index might extend its gains toward resistance level since the RSI stays above the midline.
Resistance level: 34355.00, 34900.00
Support level: 33425.00, 32745.00

The British Pound continues to gain, buoyed by a weakening dollar. Continuous dovish comments from Federal Reserve officials have hampered the dollar’s performance, with the latest Federal Open Market Committee (FOMC) meeting minutes suggesting that the Fed’s rate hikes have reached their zenith. Investor focus now shifts to the UK, awaiting key economic indicators such as GDP and production data due today, poised to influence the Pound’s strength further.
The Cable’s bullish momentum seems to have eased after its gained more than 1% in this week. The RSI and the MACD both poised flat at the higher level, suggesting the bullish momentum has eased.
Resistance level: 1.2370 , 1.2530
Support level: 1.2190, 1.12040

The New Zealand Dollar, or Kiwi, experienced a slight retreat after breaching its recent peak. Despite this, the pair has displayed robust upward momentum over the past five sessions, suggesting a strong bullish trend. With the New Zealand election on the horizon, market sentiment indicates expectations for increased stability in the Kiwi’s value. Additionally, investors are closely monitoring the upcoming U.S. Consumer Price Index (CPI) release, with widespread anticipation of a lacklustre reading that could further bolster the Kiwi’s strength in the market.
The Kiwi avoided forming a double-top price pattern and breaking above its recent peak but was trading lower last night. The RSI and the MACD decline, suggesting the bullish momentum has vanished.
Resistance level: 0.6070, 0.6130
Support level: 0.5980, 0.5890
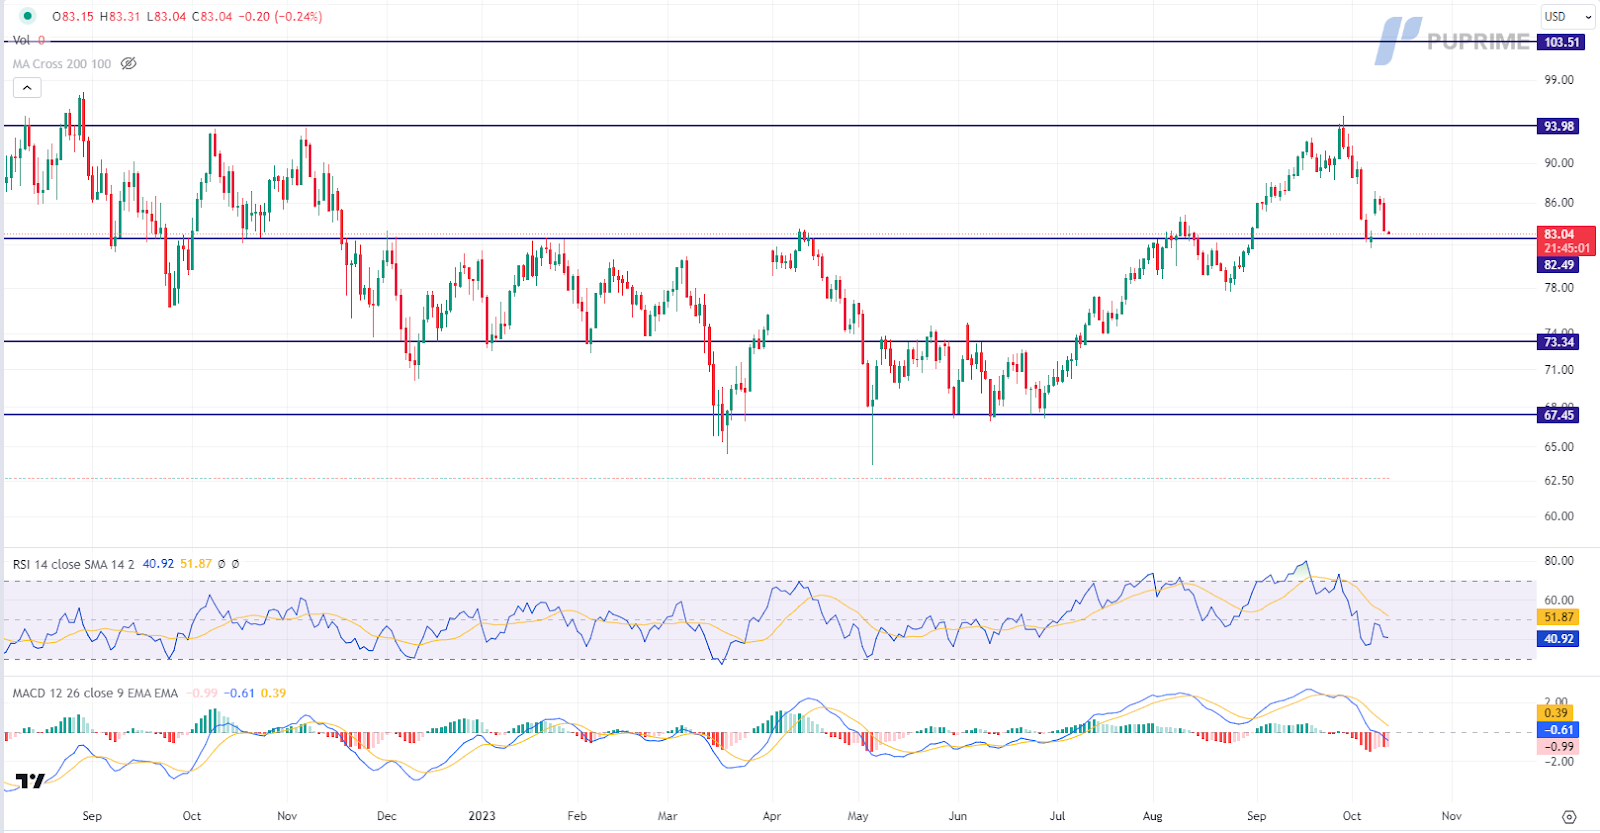
Oil prices witnessed a significant slump as OPEC’s largest producer, Saudi Arabia, moved to stabilise the market. Fears of supply disruptions amid escalating Middle East tensions prompted Saudi Arabia’s commitment to market stability. Collaborating with regional and international partners, the nation reiterated its dedication to steadying the volatile oil market.
Oil prices are trading lower while currently testing the support level. MACD has illustrated increasing bearish momentum, while RSI is at 41, suggesting the commodity might extend its losses after breakout since the RSI stays below the midline.
Resistance level: 94.00, 103.50
Support level: 82.50, 73.35
Step into the world of trading with confidence today. Open a free PU Prime live CFD trading account now to experience real-time market action, or refine your strategies risk-free with our demo account.
This content is for educational and informational purposes only and should not be considered investment advice, a personal recommendation, or an offer to buy or sell any financial instruments.
This material has been prepared without considering any individual investment objectives, financial situations. Any references to past performance of a financial instrument, index, or investment product are not indicative of future results.
PU Prime makes no representation as to the accuracy or completeness of this content and accepts no liability for any loss or damage arising from reliance on the information provided. Trading involves risk, and you should carefully consider your investment objectives and risk tolerance before making any trading decisions. Never invest more than you can afford to lose.

Trade forex, indices, metal, and more at industry-low spreads and lightning-fast execution.
Sign up for a PU Prime Live Account with our hassle-free process.
Effortlessly fund your account with a wide range of channels and accepted currencies.
Access hundreds of instruments under market-leading trading conditions.
Trading Platforms
Learn
About PU Prime
Corporate

Please note the Website is intended for individuals residing in jurisdictions where accessing the Website is permitted by law.
Please note that PU Prime and its affiliated entities are neither established nor operating in your home jurisdiction.
By clicking the "Acknowledge" button, you confirm that you are entering this website solely based on your initiative and not as a result of any specific marketing outreach. You wish to obtain information from this website which is provided on reverse solicitation in accordance with the laws of your home jurisdiction.
Thank You for Your Acknowledgement!
Ten en cuenta que el sitio web está destinado a personas que residen en jurisdicciones donde el acceso al sitio web está permitido por la ley.
Ten en cuenta que PU Prime y sus entidades afiliadas no están establecidas ni operan en tu jurisdicción de origen.
Al hacer clic en el botón "Aceptar", confirmas que estás ingresando a este sitio web por tu propia iniciativa y no como resultado de ningún esfuerzo de marketing específico. Deseas obtener información de este sitio web que se proporciona mediante solicitud inversa de acuerdo con las leyes de tu jurisdicción de origen.
Thank You for Your Acknowledgement!