


-
- Trading Platforms
- PU Prime App
- MetaTrader 5
- MetaTrader 4
- PU Copy Trading
- Web Trader
- PU Social
-
- Trading Conditions
- Account Types
- Spreads, Costs & Swaps
- Deposits & Withdrawals
- Fee & Charges
- Trading Hours


EN
11 October 2023,05:30
Daily Market Analysis
11 October 2023, 05:30


Investors navigated a cautious market terrain as more Federal Reserve officials echoed dovish sentiments, indicating the necessity of maintaining rates at a restrictive level to curb inflation. Anticipation mounts ahead of the September FOMC meeting minutes, expected to provide insights into the Fed’s decision-making. This sentiment fostered a positive atmosphere in equity markets, leading to a rise in stocks. Simultaneously, the VIX index, measuring market fear, dipped to its October low. Amid escalating tensions in the Middle East, both gold and oil prices held firm at higher levels. In a contrasting move, China is having plans for a robust economic stimulus, aiming to boost growth via a higher budget deficit, potentially bolstering proxy currencies like the Aussie and Kiwi dollars.
Current rate hike bets on 1st November Fed interest rate decision:
Source: CME Fedwatch Tool
0 bps (88.0%) VS 25 bps (12%)


US Treasury yields retreated along with the Dollar, responding to the dovish stances of several prominent Federal Reserve members. Atlanta Federal Reserve President Raphael Bostic’s recent comments have only amplified expectations that the Federal Reserve will maintain interest rates at their current levels in the upcoming month. The Federal Reserve Rate Monitor Tool is indicating a significant shift in market sentiment, with traders now assigning a mere 13% probability of an interest rate hike. This represents a notable decline from the 31% chance predicted just a week ago.
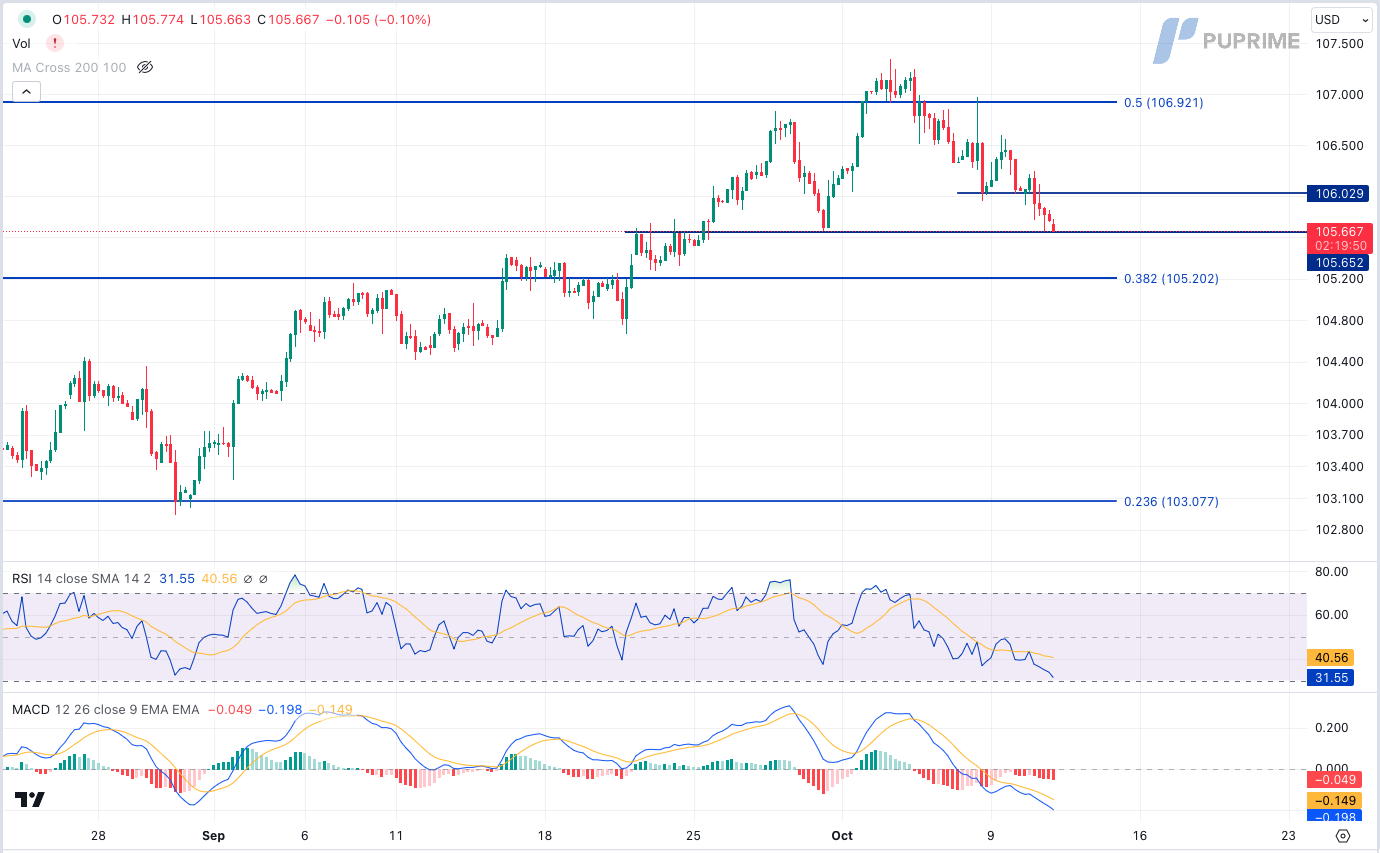
The Dollar Index is trading lower while currently testing the support level. MACD has illustrated increasing bearish momentum, while RSI is at 32, suggesting the index might enter oversold territory.
Resistance level: 106.05, 106.90
Support level: 105.65, 105.20
In the context of the dovish Fed stance and the ongoing depreciation of the US Dollar, gold is emerging as a preferred asset for investors. This dual dynamic is fuelling substantial demand for the precious metal, underlining its role as a safe haven asset during times of economic uncertainty and inflationary concerns. The combination of the Federal Reserve’s approach and dollar depreciation is further amplifying this trend.
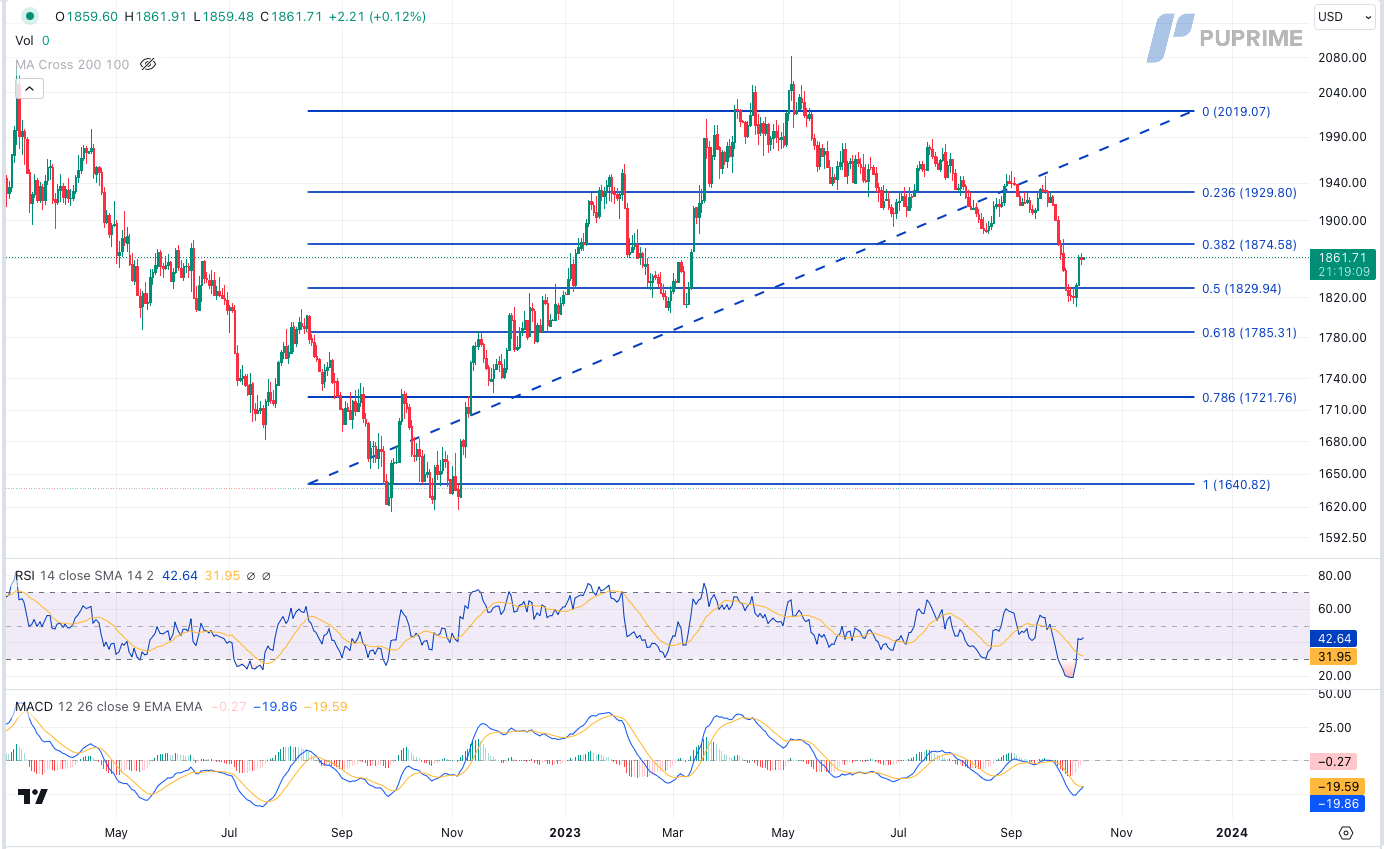
Gold prices are trading higher while currently near the resistance level. MACD has illustrated diminishing bearish momentum, while RSI is at 43, suggesting the commodity might extend its gains after breakout since the RSI rebounded sharply from oversold territory.
Resistance level: 1875.00, 1930.00
Support level: 1830.00, 1785.00
The euro’s uptrend gains momentum, marking a robust reversal from its prolonged downtrend, and is now comfortably within an upward trading channel. This resurgence is fueled by a softening dollar, as echoed by several Federal Reserve officials’ dovish statements. The collective sentiment in the market speculates that the Fed might halt further interest rate hikes, effectively curbing the dollar’s strength. This scenario has provided the euro with a solid foothold, raising prospects for sustained growth in the near term. Investors closely watch evolving developments as the currency dynamics continue to shift.
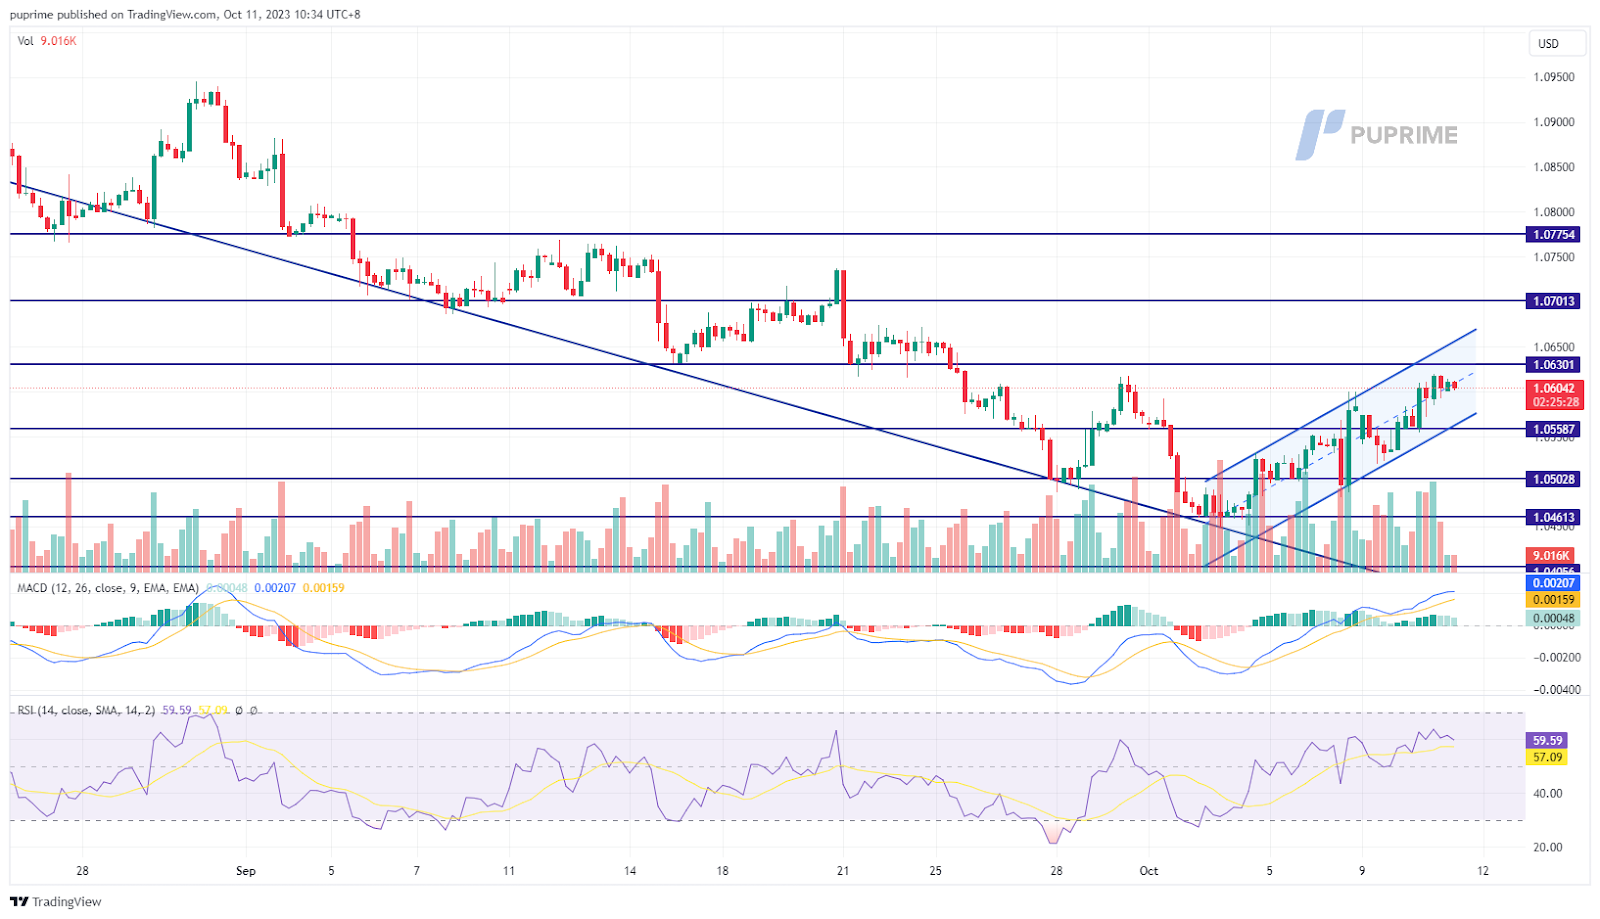
The EUR/USD pair is currently trading in an uptrend channel and exhibits a strong bullish trend for the pair. The RSI as well as the MACD continue to flow upward suggesting the bullish momentum is strong.
Resistance level: 1.0630, 1.0700
Support level: 1.0500, 1.0460

USD/JPY dipped as the anticipation of pivotal US economic data triggered a bout of risk aversion in the global financial landscape. This shift prompted investors to shy away from the US market, with a noticeable pivot towards the safe-haven Japanese yen. The impending release of the US Producer Price Index (PPI) figures this Wednesday carries the potential for significant volatility in the US Dollar. As market sentiment has begun to dial down expectations of further rate hikes from the Federal Reserve, any unexpected upswing in inflationary indicators could trigger significant volatilities in the Dollar.
USD/JPY is trading lower while currently testing the support level. MACD has illustrated diminishing bearish momentum, while RSI is at 47, suggesting the pair might experience technical correction since the RSI stays below the midline.
Resistance level: 149.95, 151.45
Support level: 148.40, 147.50

The US equity market surged in the face of these dovish signals. Notably, major US benchmark stock indexes have posted gains for the third consecutive day. These gains can be attributed, in large part, to the Federal Reserve’s dovish comments, which have led to a substantial drop in the 10-year Treasury yield.
The Dow is trading higher while currently testing the resistance level. MACD has illustrated increasing bullish momentum, while RSI is at 46, suggesting the index might extend its gains after breakout since the RSI rebounded sharply from oversold territory.
Resistance level: 33750.00, 34575.00
Support level: 32620.00, 31700.00

The British Pound displays a robust trend reversal, surging beyond its extended downtrend channel. This momentum coincides with a further softening of the dollar in anticipation of pivotal releases: the September FOMC meeting minutes and the upcoming U.S. CPI data. Investors keenly await insights from the meeting minutes, pivotal in shaping the Fed’s monetary stance. Market sentiment leans toward a lower U.S. CPI reading, indicating easing pricing pressures in the U.S. These events are poised to influence currency dynamics, shaping the Pound’s trajectory amidst evolving market conditions.
The Cable is trading firmly above its long-term downtrend channel and has broken above its near resistance at the 1.2250 level. The RSI and the MACD continue to move upward, suggesting the bullish momentum is strong.
Resistance level: 1.2370 , 1.2530
Support level: 1.2190, 1.12040
The Australian dollar strengthens against the USD, bolstered by dovish comments from Fed officials, softening the greenback’s stance. Anticipation builds around the RBA’s potential rate hike, with economists predicting an increase to 4.35%, marking Australia’s highest rate in three decades. Financial market indicators reflect a 50% chance of this move, underscoring the growing expectations for an upward adjustment.
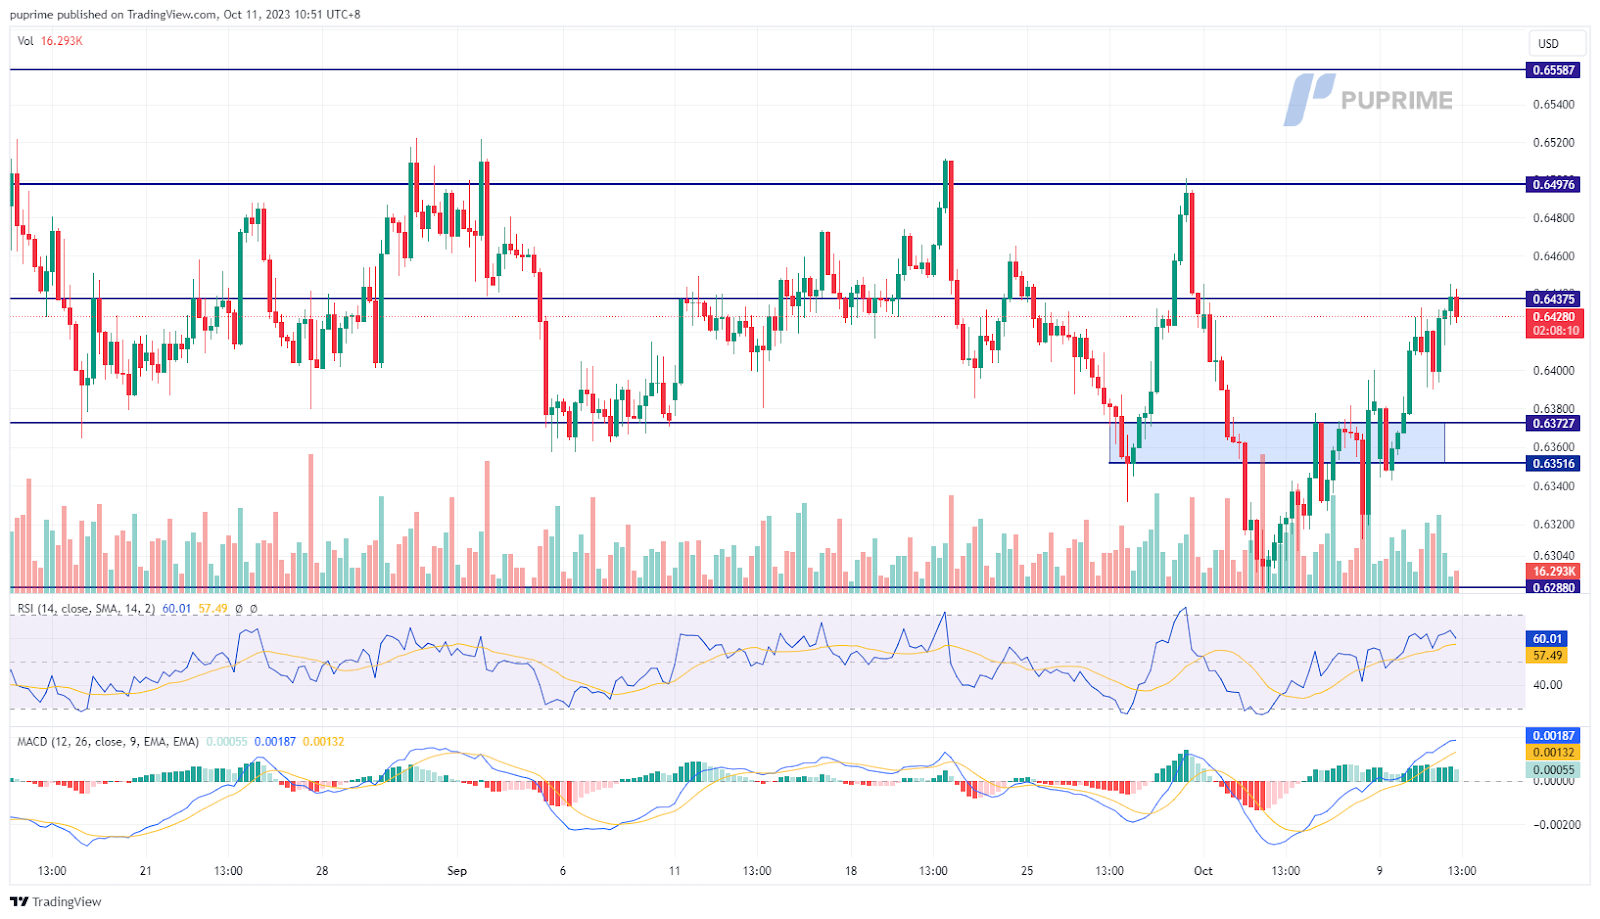
The AUD/USD pair broke above its crucial pivotal range at near 0.6370 and continued to surge, signalling a strong trend reversal. The RSI and the MACD continue to move upward, suggesting the bullish momentum is strong.
Resistance level: 0.6440, 0.6500
Support level: 0.6370, 0.6290

Oil markets remain on an upward trajectory, driven by a combination of factors. Mounting tensions in the Middle East, typified by recent Israeli airstrikes in Gaza, have raised concerns of supply disruptions, further fuelling bullish momentum in the oil market. Concurrently, the depreciation of the US Dollar, an effect of the Federal Reserve’s dovish stance, is lending additional support to the ongoing rally in oil prices.
Oil prices are trading higher while currently testing the resistance level. However, MACD has illustrated diminishing bullish momentum, while RSI is at 53, suggesting the commodity might continue to hover around the resistance level since the RSI stays near the midline.
Resistance level: 86.40, 88.35
Support level: 83.90, 80.35
Step into the world of trading with confidence today. Open a free PU Prime live CFD trading account now to experience real-time market action, or refine your strategies risk-free with our demo account.
This content is for educational and informational purposes only and should not be considered investment advice, a personal recommendation, or an offer to buy or sell any financial instruments.
This material has been prepared without considering any individual investment objectives, financial situations. Any references to past performance of a financial instrument, index, or investment product are not indicative of future results.
PU Prime makes no representation as to the accuracy or completeness of this content and accepts no liability for any loss or damage arising from reliance on the information provided. Trading involves risk, and you should carefully consider your investment objectives and risk tolerance before making any trading decisions. Never invest more than you can afford to lose.

Trade forex, indices, metal, and more at industry-low spreads and lightning-fast execution.
Sign up for a PU Prime Live Account with our hassle-free process.
Effortlessly fund your account with a wide range of channels and accepted currencies.
Access hundreds of instruments under market-leading trading conditions.
Trading Platforms
Learn
About PU Prime
Corporate

Please note the Website is intended for individuals residing in jurisdictions where accessing the Website is permitted by law.
Please note that PU Prime and its affiliated entities are neither established nor operating in your home jurisdiction.
By clicking the "Acknowledge" button, you confirm that you are entering this website solely based on your initiative and not as a result of any specific marketing outreach. You wish to obtain information from this website which is provided on reverse solicitation in accordance with the laws of your home jurisdiction.
Thank You for Your Acknowledgement!
Ten en cuenta que el sitio web está destinado a personas que residen en jurisdicciones donde el acceso al sitio web está permitido por la ley.
Ten en cuenta que PU Prime y sus entidades afiliadas no están establecidas ni operan en tu jurisdicción de origen.
Al hacer clic en el botón "Aceptar", confirmas que estás ingresando a este sitio web por tu propia iniciativa y no como resultado de ningún esfuerzo de marketing específico. Deseas obtener información de este sitio web que se proporciona mediante solicitud inversa de acuerdo con las leyes de tu jurisdicción de origen.
Thank You for Your Acknowledgement!