


-
- Trading Platforms
- PU Prime App
- MetaTrader 5
- MetaTrader 4
- PU Copy Trading
- Web Trader
- PU Social
-
- Trading Conditions
- Account Types
- Spreads, Costs & Swaps
- Deposits & Withdrawals
- Fee & Charges
- Trading Hours


EN
12 September 2023,05:56
Daily Market Analysis
12 September 2023, 05:56

Bank of Japan (BoJ) Governor Ueda’s hawkish statements over the weekend have contributed to the strength of the Japanese Yen during the Asian morning session. Ueda mentioned that the Japanese Central Bank may have enough data by the end of the year to assess whether wage growth and inflation in Japan are rising sustainably. At the same time, the US dollar has shown remarkable strength, recording an 8-week winning streak, a move not witnessed since 2005. This strength is attributed to resilient US economic data, which has heightened expectations of further interest rate hikes from the Federal Reserve. However, this strong dollar has pressured gold prices and the equity market. Meanwhile, oil prices have remained steady, hovering near the $87 mark amid concerns over dwindling oil supplies.
Current rate hike bets on 20th September Fed interest rate decision:
Source: CME Fedwatch Tool
0 bps (93.0%) VS 25 bps (7.0%)


The US Dollar took a step back in anticipation of pivotal US inflation data, prompting a wave of portfolio adjustments by investors seeking refuge from potential market turbulence. Despite widespread expectations that the US central bank will hold off on interest rate hikes this month, policymakers remain cautious about declaring victory over inflation. With monetary decisions closely tied to data, prudent investors are urged to maintain vigilance, continuously monitoring forthcoming US economic indicators to assess the trajectory of the US Dollar.
The dollar index is trading lower while currently testing the support level. MACD has illustrated increasing bearish momentum, while RSI is at 45, suggesting the index might extend its losses after breakout since the RSI stays below the midline.
Resistance level: 105.25, 106.25
Support level: 104.25, 103.05

The gold market continues to consolidate within a defined range, restrained by the absence of significant market drivers. Investor focus sharpens this week on key economic data releases. Wednesday’s eagerly anticipated consumer price data and Thursday’s revelations regarding producer prices and retail sales figures will serve as critical barometers, poised to exert significant influence on the several major asset classes.
Gold prices are trading lower following the prior retracement from the resistance level. MACD has illustrated diminishing bullish momentum, while RSI is at 46, suggesting the commodity might extend its losses since the RSI stays below the midline.
Resistance level: 1930.00, 1950.00
Support level: 1910.00, 1885.00
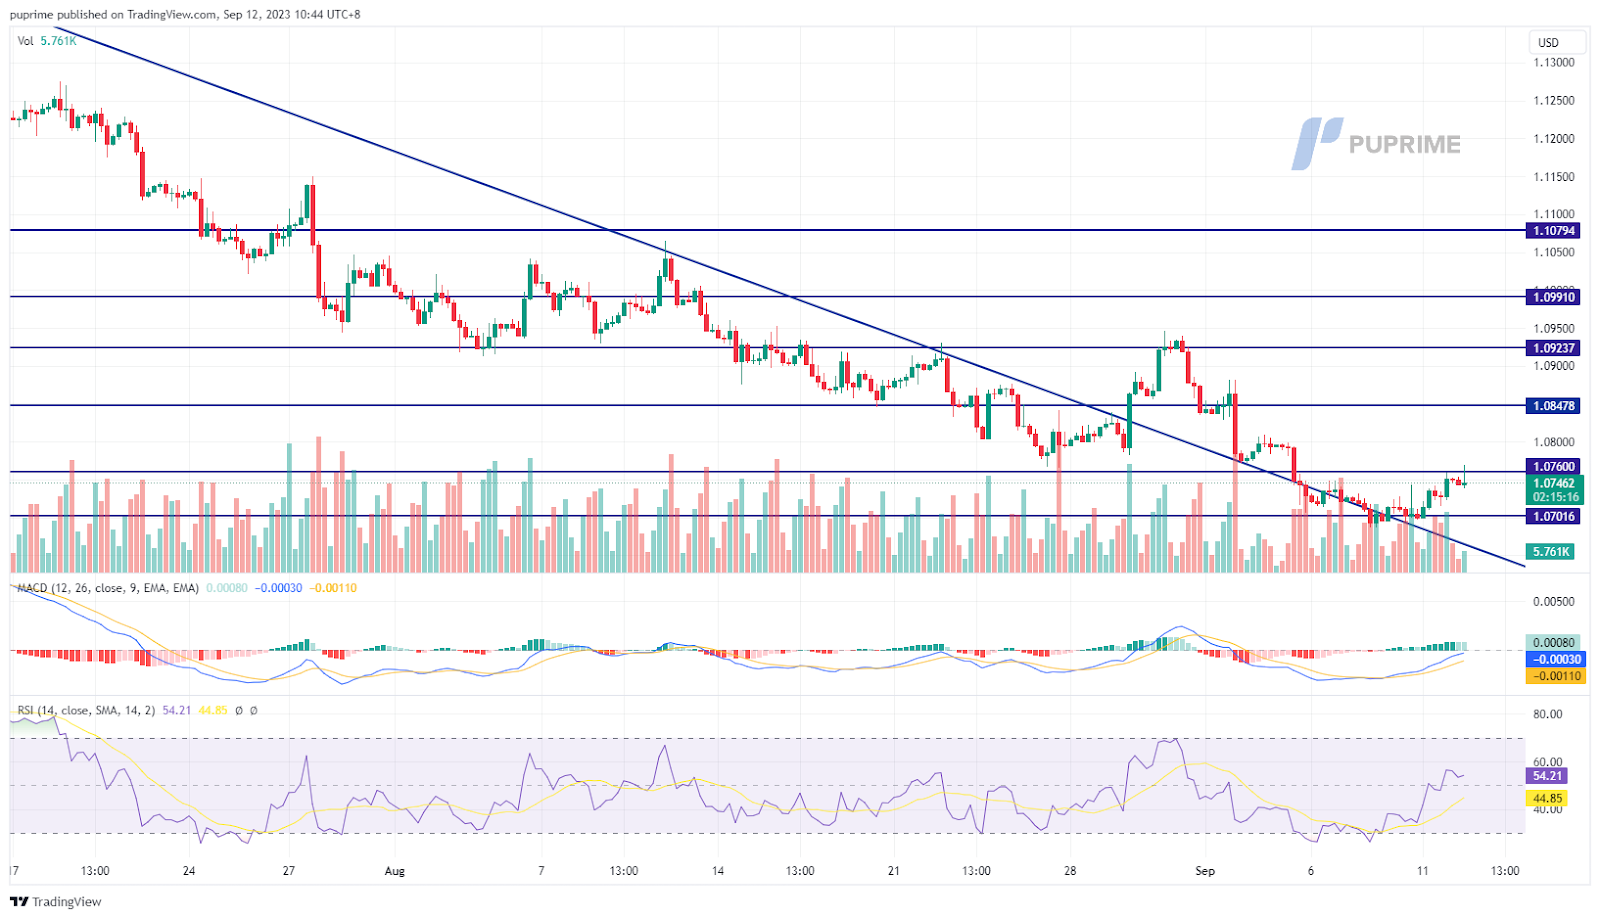
The euro has been gradually rising while the dollar is in a holding pattern, with investors awaiting the release of the crucial U.S. Consumer Price Index (CPI) scheduled for Wednesday. A strong CPI reading could prompt a more aggressive response from the Federal Reserve, potentially leading to a stronger dollar. Conversely, the European Central Bank (ECB) is expected to announce its interest rate decision on Thursday, and the market consensus is that the ECB will maintain its current interest rate level due to lacklustre economic growth in the eurozone.
EUR/USD has shown signs of a trend reversal after it consolidated at the strong support level of 1.0700 level. The RSI has gained above the 50 level while the MACD is breaking above the zero line, suggesting a bullish momentum is forming.
Resistance level: 1.0970, 1.1235
Support level: 1.0690, 1.0540
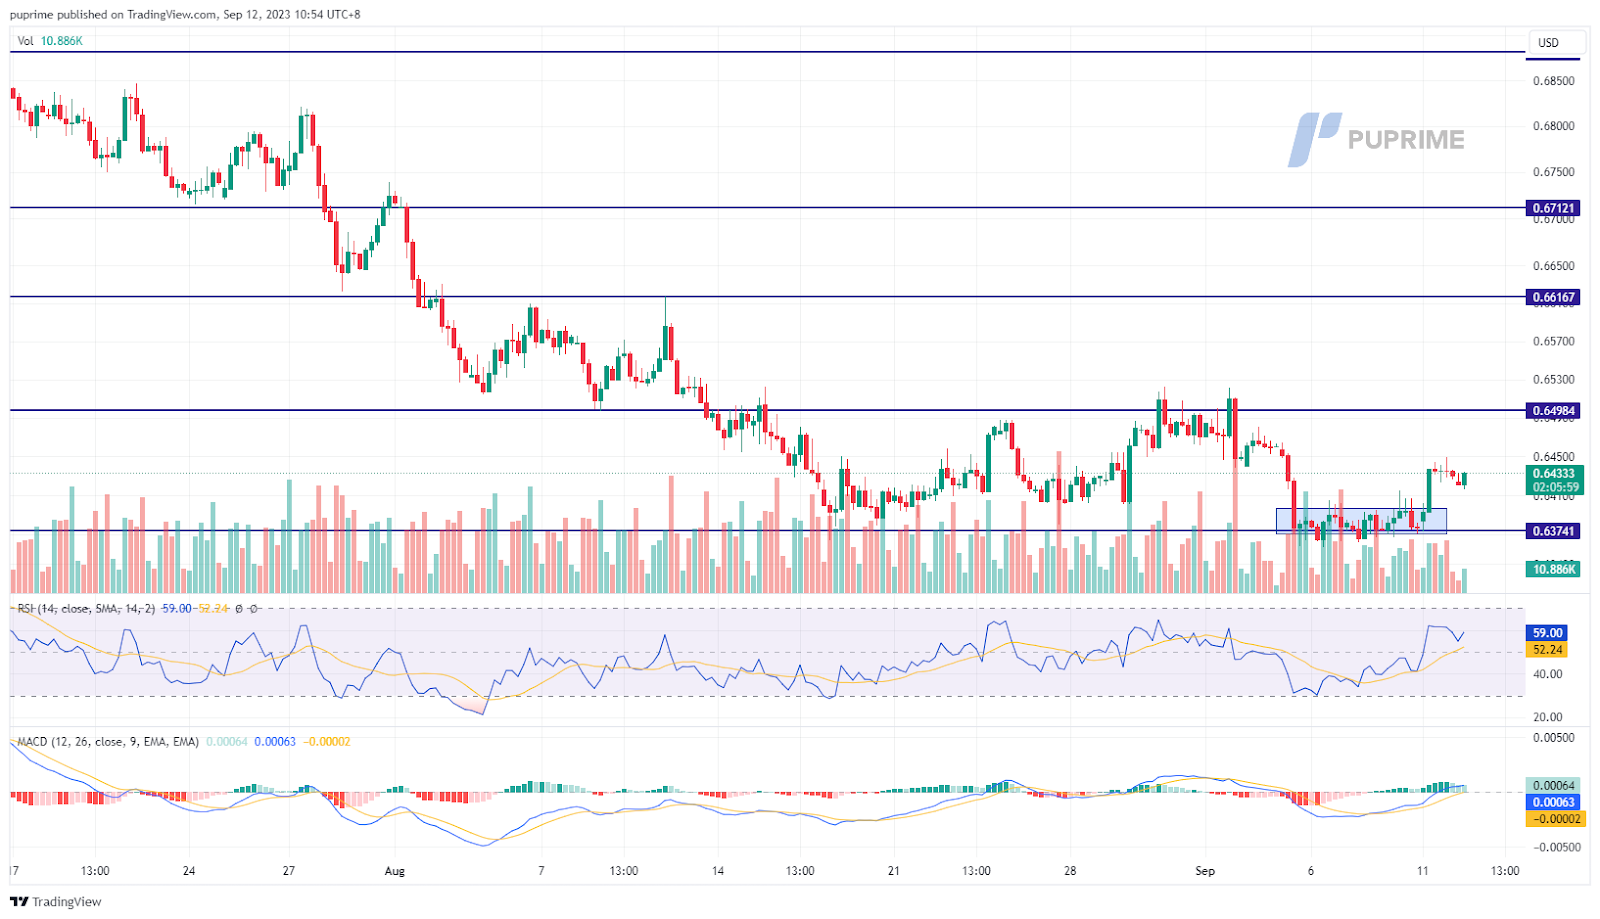
The Australian dollar managed to rebound from its lowest level since last November, which was partly due to the Reserve Bank of Australia (RBA) pausing its rate hike program due to the country’s lacklustre economic performance. However, the Aussie dollar received a boost from optimistic economic data out of China that was released yesterday. This data, particularly the China New Loans figures, showed a significant improvement, signalling a potential revival in China’s struggling economy. This positive news encouraged investors, and the Australian dollar traded higher as a result.
The Aussie dollar broke above its price consolidation range signalling a trend reversal for the pair. The RSI has been gaining while the MACD has broken above the zero line suggesting the bullish momentum is growing.
Resistance level: 0.6500, 0.6610
Support level: 0.6370, 0.6200

The Japanese Yen experienced a dramatic surge as Bank of Japan (BoJ) Governor Kazuo Ueda raised expectations that the BoJ might consider departing from its negative interest rates policy, provided it can attain its inflation target. The Japanese Yen’s trajectory is expected to be marked by heightened volatility, as market participants closely monitor any potential intervention by Japan to bolster the yen, especially after it weakened beyond the 145-per-dollar threshold last month.
USD/JPY is trading lower while currently testing the support level. However, MACD has illustrated diminishing bearish momentum, while RSI is at 46, suggesting the pair might experience technical correction since the RSI rebounded sharply from oversold territory.
Resistance level: 147.75, 149.30
Support level: 146.25, 144.70

US equity markets posted gains driven by optimism that the Federal Reserve will maintain its current interest rates during its upcoming meeting this month. This sentiment arises from the perception that the Fed is nearing the conclusion of its rate hike trajectory. Concurrently, US Treasury yields dipped, reflecting market sentiment that the Fed may conclude its monetary tightening cycle. Nevertheless, market volatilities persist in anticipation of critical US inflation data.
Nasdaq is trading higher while currently near the resistance level. MACD has illustrated diminishing bearish momentum, while RSI is at 59, suggesting the index might extend its gains toward resistance level since the RSI stays above the midline.
Resistance level: 15780.00, 16585.00
Support level: 14610.00, 13660.00

Oil prices retraced slightly from their 10-month highs following an impressive rally, prompted by Saudi Arabia and Russia’s decision to extend voluntary supply cuts until year-end. The International Energy Agency and the Organization of the Petroleum Exporting Countries are poised to release their monthly reports this week. Investors are closely monitoring these reports for insights into expected demand growth, particularly considering recent data suggesting a cooling trend in the vital Chinese economy.
Oil prices are trading higher while currently testing the resistance level. MACD has illustrated diminishing bearish momentum. RSI is at 57, suggesting the commodity might extend its gains after breakout since the RSI stays above the midline.
Resistance level: 87.70, 92.30
Support level: 84.45, 81.25
Step into the world of trading with confidence today. Open a free PU Prime live CFD trading account now to experience real-time market action, or refine your strategies risk-free with our demo account.
This content is for educational and informational purposes only and should not be considered investment advice, a personal recommendation, or an offer to buy or sell any financial instruments.
This material has been prepared without considering any individual investment objectives, financial situations. Any references to past performance of a financial instrument, index, or investment product are not indicative of future results.
PU Prime makes no representation as to the accuracy or completeness of this content and accepts no liability for any loss or damage arising from reliance on the information provided. Trading involves risk, and you should carefully consider your investment objectives and risk tolerance before making any trading decisions. Never invest more than you can afford to lose.

Trade forex, indices, metal, and more at industry-low spreads and lightning-fast execution.
Sign up for a PU Prime Live Account with our hassle-free process.
Effortlessly fund your account with a wide range of channels and accepted currencies.
Access hundreds of instruments under market-leading trading conditions.
Trading Platforms
Learn
About PU Prime
Corporate

Please note the Website is intended for individuals residing in jurisdictions where accessing the Website is permitted by law.
Please note that PU Prime and its affiliated entities are neither established nor operating in your home jurisdiction.
By clicking the "Acknowledge" button, you confirm that you are entering this website solely based on your initiative and not as a result of any specific marketing outreach. You wish to obtain information from this website which is provided on reverse solicitation in accordance with the laws of your home jurisdiction.
Thank You for Your Acknowledgement!
Ten en cuenta que el sitio web está destinado a personas que residen en jurisdicciones donde el acceso al sitio web está permitido por la ley.
Ten en cuenta que PU Prime y sus entidades afiliadas no están establecidas ni operan en tu jurisdicción de origen.
Al hacer clic en el botón "Aceptar", confirmas que estás ingresando a este sitio web por tu propia iniciativa y no como resultado de ningún esfuerzo de marketing específico. Deseas obtener información de este sitio web que se proporciona mediante solicitud inversa de acuerdo con las leyes de tu jurisdicción de origen.
Thank You for Your Acknowledgement!