Sterling experienced a sharp drop of nearly 1% following the release of CPI data.
Last night, the dollar index surpassed $100 following the release of CPI data for both the UK and Eurozone; as the Sterling experienced a sharp drop of nearly 1%, while the euro also showed a slight decline. The CPI figures indicated that inflation in these regions is showing signs of moderating. Meanwhile, the U.S. dollar continues to face pressure due to disappointing economic data, such as lower-than-expected retail sales and industrial production numbers. In another development, Bloomberg’s economists predict that the BoJ is unlikely to make any adjustments to its monetary policy in the near future. However, they suggest that October is now emerging as the most probable month for a potential move by the BoJ. Elsewhere, oil prices have been affected by a slight strengthening of the dollar and profit-taking activities. This occurred after U.S. crude oil inventories fell, but the decline was less significant than expected.
Current rate hike bets on 26th July Fed interest rate decision:
Source: CME Fedwatch Tool
0 bps (1%) VS 25 bps (99%)
Market Overview
Economic Calendar
Market Movements
DOLLAR_INDX, Daily
Following the downbeat UK inflation report, the Dollar Index, measuring the USD against six major currencies, saw a slight recovery. Consequently, the Pound plummeted by as much as 1.30% in its largest intraday drop in over four months. Investors favoured the US Dollar, bolstered by US Treasury gains ahead of the FOMC interest rate decisions, while closely monitoring the Fed’s monetary statement for further trading signals.
The dollar index is lower following the prior breakout below the previous support level. However, MACD has illustrated diminishing bearish momentum, while RSI is at 33, suggesting the index might enter oversold territory.
Resistance level: 101.45, 104.25
Support level: 98,70, 94.75
XAU/USD, H4
Gold prices continued to hover in a positive trajectory, benefiting from slowing inflationary pressures in the US. The weakening US Dollar prompted investors to favour dollar-denominated gold. Disappointing economic data from the US and speculations of a more dovish stance from the Federal Reserve contributed to negative trajectories in US Treasury yields. Investors are closely monitoring the FOMC interest rate decisions to gauge potential further movements in gold prices.
Gold prices are trading flat while currently near the resistance level, MACD has illustrated diminishing bearish momentum, while RSI is at 56, suggesting the commodity might be traded higher since the RSI stays above the midline.
Resistance level: 1985.00, 2000.00
Support level: 1970.00, 1950.00
EUR/USD,H4
Last night, the Euro exhibited a sideways trading pattern and experienced a minor decline following the release of the European CPI data. The CPI reading indicated that the inflation rate in Europe showed signs of moderating, with the figure dropping to 5.5% from the previous reading of 6.1%. The market had already anticipated this outcome, and as a result, it had already been factored into investors’ expectations, leading to a limited impact on the Euro pair. Despite the moderate CPI data, the market is still anticipating a 25 basis points increase in interest rates next week when the European Central Bank (ECB) announces its interest rate decision. This expectation will likely continue influencing the market sentiment in the near term.
EUR/USD has been trading sideways for the past week after spiking drastically when the U.S. inflation data was released last week. Although the pair is still trading above the moving average line, the RSI and the MACD are declining suggesting the bullish momentum has eased.
Resistance level: 1.1338, 1.1410
Support level: 1.1157, 1.1088
AUD/USD,H4
In the early Asian trading hours, the Australian dollar strengthened due to a positive employment report, surpassing expectations. This development has led to predictions that the RBA may consider further raising interest rates. Specifically, the Australia Employment change increased by 32.6k, and the unemployment rate declined to 3.6%. These figures indicate that the country’s labour market remains tight and could potentially result in a higher inflation rate in the future. Contrarily, the U.S. dollar continues to trade lower, primarily due to disappointing economic data, weakening its position in the market. The downbeat economic indicators have contributed to a softer U.S. dollar, which is currently facing hindrances in its performance.
AUD/USD rebounded on the Fibonacci 61.8% and indicators such as the RSI and the MACD have rebounded suggesting a trend reversal for the pair.
Resistance level: 0.6844, 0.6878
Support level: 0.6795, 0.6766
GBP/USD,H4
The Pound Sterling experienced a sharp decline as UK inflation slowed more than anticipated in June, reaching its lowest level in over a year at 7.90%, falling short of economists’ 8.20% forecast. This led investors to scale back expectations of future borrowing cost increases, projecting a more modest 25 basis points rate hike on 3rd August instead of the previously priced-in 50 basis points.
GBP/USD is trading lower while currently testing the support level. MACD has illustrated diminishing bullish momentum, while RSI is at 60, suggesting the pair might extend its losses after breakout its support level since the RSI retreated sharply from its overbought territory.
Resistance level: 1.3135, 1.3470
Support level: 1.2875, 1.2460
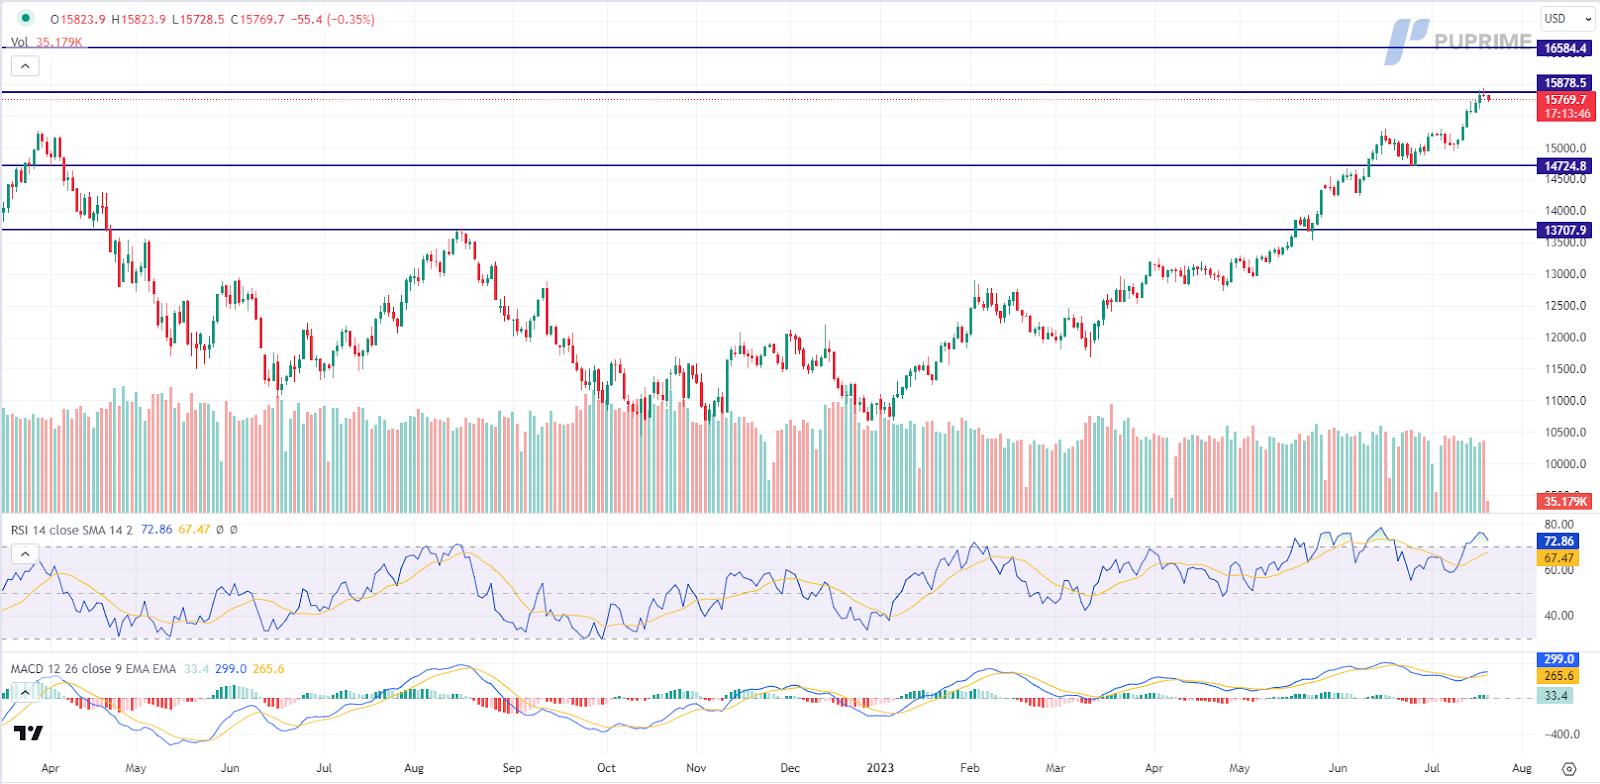
Nasdaq, H4
The US equity market consolidated at a crucial resistance level amid mixed sentiment from the US market. Caution gripped the US equity market as companies such as Netflix Inc and Tesla reported disappointing results. Netflix’s sales missed estimates, causing its stock to decline by 8.18% in post-market trading. Likewise, Tesla’s profitability shrank in the second quarter, resulting in a 4.98% drop, signalling pressure on the electric-vehicle maker’s margins.
Nasdaq is trading higher while currently testing the resistance level. However, MACD has illustrated diminishing bullish momentum, while RSI is at 73, suggesting the index might enter overbought territory.
Resistance level: 15880.00, 16585.00
Support level: 14725.00, 13710.00
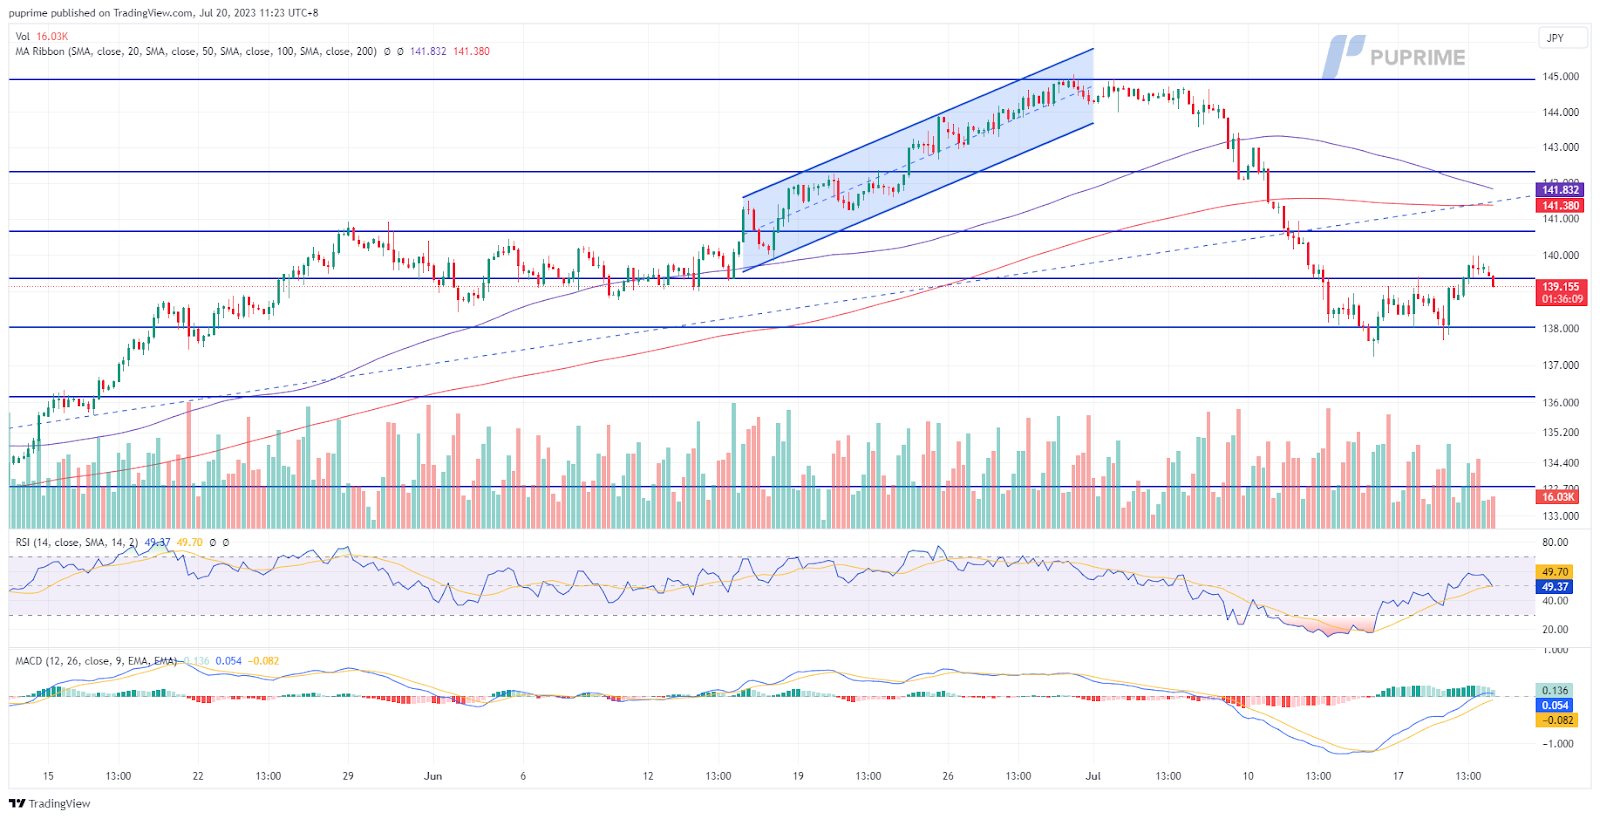
USD/JPY, H4
The Japanese yen decreased its bullish momentum, leading to a technical rebound in the currency pair as the dollar gained some strength. However, the recent downbeat U.S. economic data, particularly concerning retail sales and industrial production, has impeded the dollar’s ability to strengthen further. Consequently, it is expected that the currency pair will continue its downtrend in the near future. In addition, economists predict that the BoJ is unlikely to make any immediate changes to its monetary policy. However, they believe that the BoJ may consider making a move in October, indicating that this could be the month when any potential adjustments to the monetary policy might occur.
USD/JPY experienced a technical rebound when the pair traded to its recent low at near 138 level. The RSI has rebounded from the oversold zone while the MACD has crossed and is moving in an uptrend suggesting the bearish momentum has eased.
Resistance level: 140.67, 141.83
Support level: 138.05, 136.15
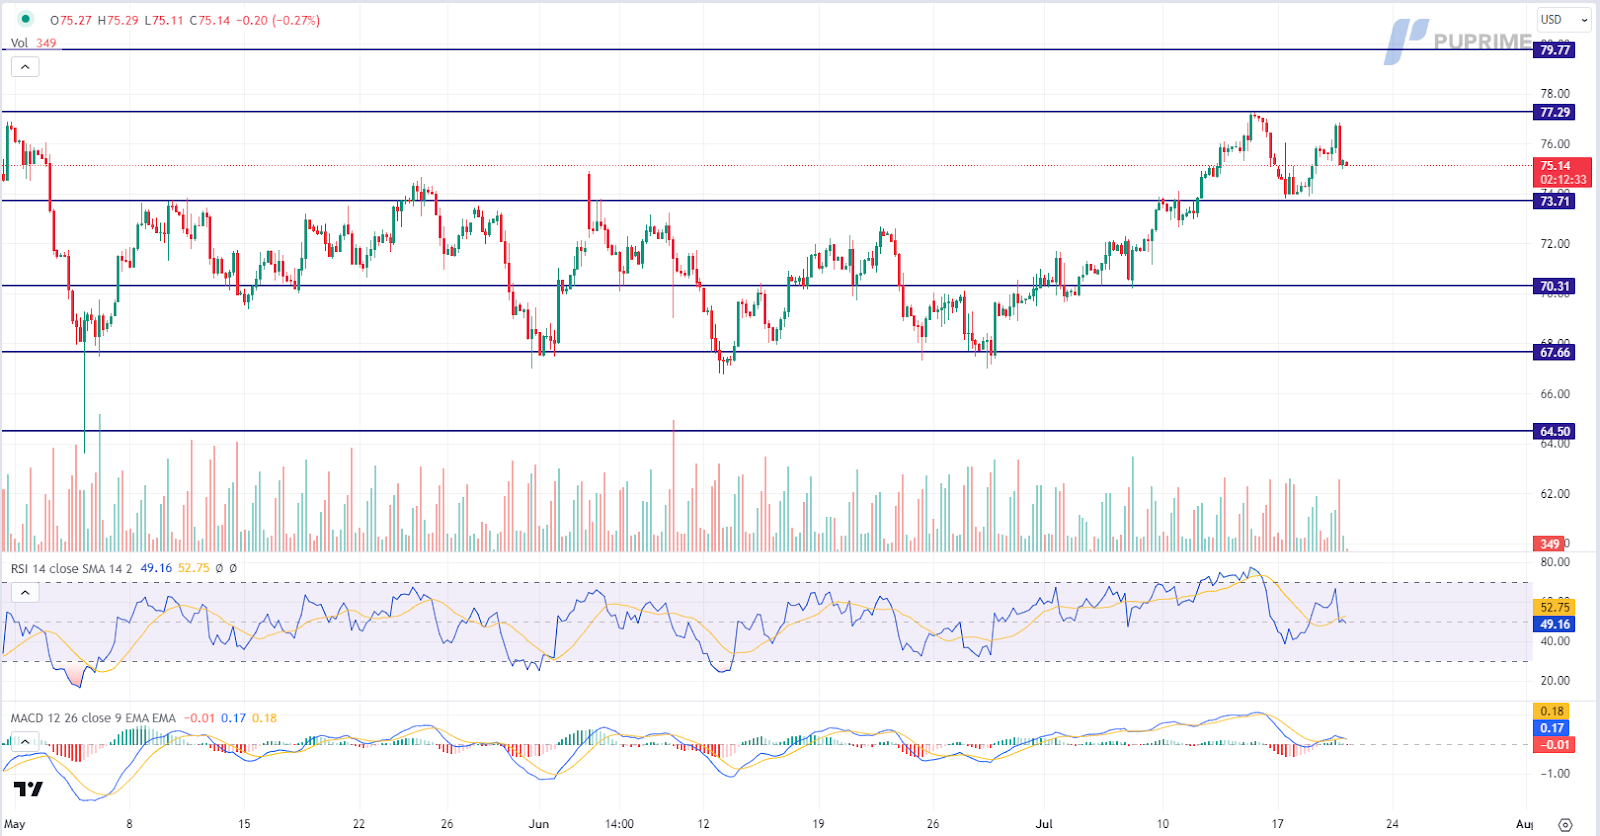
CL OIL, H4
The oil market experienced consolidation around crucial resistance levels as investors sought further catalysts amidst mixed market sentiment. Positive factors, such as expectations of OPEC+ production cuts and the potential end of tightening monetary policies, supported oil prices by boosting demand. However, a slight retreat occurred after government data revealed US crude inventories fell by only 708,000 barrels, significantly below the expected 2.44-million-barrel decline.
Oil prices are trading lower following the prior retracement from the resistance level. MACD has illustrated diminishing bullish momentum, while RSI is at 49, suggesting the commodity might extend its losses since the RSI retreated sharply from overbought territory.
Resistance level: 77.30, 79.75
Support level: 73.70, 70.30
Start trading with an edge today
Trade forex, indices, metal, and more at industry-low spreads and lightning-fast execution.
Start trading with deposits as low as $50 on our standard accounts.
Get access to 24/7 support.
Access hundreds of instruments, free educational tools, and some of the best promotions around.
Important Notice: Please note the Website is intended for individuals residing in jurisdictions where accessing the Website is permitted by law.
Please note that PU Prime and its affiliated entities are neither established nor operating in your home jurisdiction.
By clicking the "Acknowledge" button, you confirm that you are entering this website solely on your own initiative and not as a result of any specific marketing outreach. You wish to obtain information from this website which is provided on a reverse solicitation basis in accordance with the laws of your home jurisdiction.
Please note the Website is intended for individuals residing in jurisdictions where accessing the Website is permitted by law.
Please note that PU Prime and its affiliated entities are neither established nor operating in your home jurisdiction.
By clicking the "Acknowledge" button, you confirm that you are entering this website solely based on your initiative and not as a result of any specific marketing outreach. You wish to obtain information from this website which is provided on reverse solicitation in accordance with the laws of your home jurisdiction.
Ten en cuenta que el sitio web está destinado a personas que residen en jurisdicciones donde el acceso al sitio web está permitido por la ley.
Ten en cuenta que PU Prime y sus entidades afiliadas no están establecidas ni operan en tu jurisdicción de origen.
Al hacer clic en el botón "Aceptar", confirmas que estás ingresando a este sitio web por tu propia iniciativa y no como resultado de ningún esfuerzo de marketing específico. Deseas obtener información de este sitio web que se proporciona mediante solicitud inversa de acuerdo con las leyes de tu jurisdicción de origen.