-
- Trading Platforms
- PU Prime App
- MetaTrader 5
- MetaTrader 4
- PU Copy Trading
- Web Trader
- PU Social
-
- Trading Conditions
- Account Types
- Spreads, Costs & Swaps
- Deposits & Withdrawals
- Fee & Charges
- Trading Hours

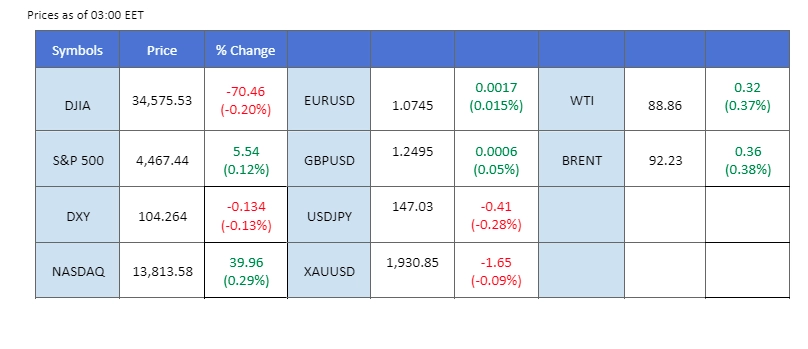
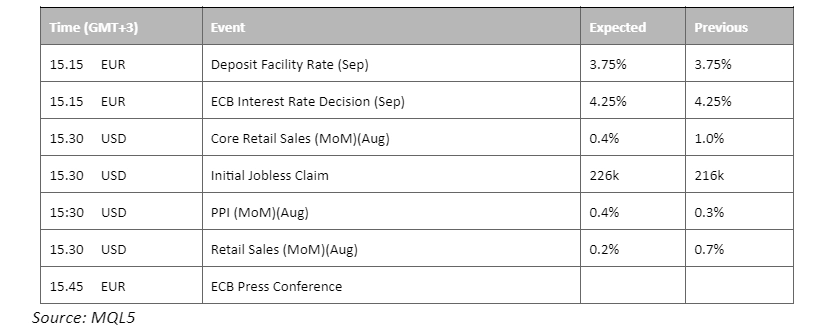
Yesterday’s U.S. CPI release showed a higher reading than both the forecasted number and the previous reading. However, it appeared that the market had already priced in this uptick in CPI, and there was a relatively muted reaction as the data indicated that inflation in the U.S. remained persistent. In contrast, Australia’s job data for August revealed a significant increase in employment change, improving from a previous reading of -1.4k to 64.9k, while the unemployment rate remained unchanged. This positive employment data provided support for the Australian dollar. Meanwhile, all eyes are on the European Central Bank (ECB) as it is scheduled to announce its interest rate decision today. This announcement may provide guidance for investors and help gauge the strength of the euro.
Current rate hike bets on 20th September Fed interest rate decision:
Source: CME Fedwatch Tool
0 bps (93.0%) VS 25 bps (7.0%)


The US dollar displayed an unexpected lack of movement during yesterday’s trading session, despite the release of the US Consumer Price Index (CPI), which indicated an uptick in the country’s inflation rate. Market sentiment had already factored in the likelihood of a higher CPI reading for August. The dollar index is presently maintaining its strength, trading above the $104.5 level, as expectations for at least one more rate hike from the Federal Reserve by the end of the year loom on the horizon.
The dollar index lost steam after it touched the $105 mark last week. The RSI hovers near the 50-level while the MACD stays flat near to the zero line giving a neutral signal for the index.
Resistance level: 105.25, 106.25
Support level: 104.25, 103.05
Gold prices were affected by the higher-than-expected US CPI reading released yesterday, causing them to edge lower. However, the market appears to have already anticipated this increase in CPI and mitigated its negative impact on gold prices. Additionally, concerns about China’s economic situation and a pessimistic global economic outlook continue supporting gold prices.
Gold prices have a lower-high pattern, suggesting the gold price is trading in a bearish trend. The RSI and the MACD are flowing in the lower territory, suggesting a bearish bias for gold prices as well.
Resistance level: 1938.00, 1967.00
Support level: 1900.00, 1870.00
The euro has been trading sideways for nearly a week, holding its ground against the strong dollar. Today, the ECB is set to announce its interest rate decision, which could introduce some volatility to the currency pair. The sluggish economic performance in the eurozone has led to market speculation of an interest rate pause by the ECB. However, if the ECB surprises with a rate hike, it could boost the euro’s strength against the dollar.
EUR/USD has consolidated for nearly a week and has a sign of rebounding. The RSI gradually moves upward while the MACD breaks above the zero line, suggesting the bullish momentum is forming.
Resistance level: 1.0760, 1.0850
Support level: 1.0700, 1.0640
The British pound has found some stability against the USD, largely due to the dollar index trading in a sideways pattern as it awaits a catalyst to determine its direction. However, investor confidence in the Sterling has been waning recently due to the lacklustre performance of the UK economy and the bankruptcy declaration of Birmingham’s city council. The UK is set to release its CPI data next week, which presents a challenge for the Bank of England (BoE) regarding its interest rate policy decisions. Both the CPI announcement and the BoE interest rate decision can potentially drive movements in the Cable.
The Sterling has eased from its bearish momentum and has broken above its long-term resistance level. The RSI is gradually moving up while the MACD is approaching the zero line from below, suggesting the bullish momentum is forming.
Resistance level: 1.2540, 1.2640
Support level: 1.2460, 1.2390
The Japanese yen is trading within a wider range, just below a significant resistance level at 147.80. It continues to exhibit strength, partly due to remarks made by the BoJ governor suggesting that the Japanese authorities might consider moving away from negative interest rates by the end of the year. This sentiment has bolstered the yen’s performance.
USD/JPY seems to be trading in a wide range from 146.10 to 147.80 while speculators continue to test the Japanese authority limit. The RSI is hovering near the 50-level range while the MACD fluctuates between the zero line, with both giving a neutral signal for the pair.
Resistance level: 148.80, 151.45
Support level: 145.00, 141.90
The Nasdaq and other U.S. equity indexes appeared unfazed by yesterday’s higher U.S. CPI reading. Leading companies like Tesla, Meta, and Amazon saw gains of over 1%, contributing to the index closing higher. The inflationary pressures indicated by the CPI, lead the market to expect at least one more rate hike from the Fed before the year’s end, as the targeted 2% inflation rate has not been reached yet.
Nasdaq’s bullish momentum is losing steam and is suppressed under a strong resistance level at 15780. The RSI is still hovering at a higher level while the MACD stays flat, suggesting the index is still trading in a bullish momentum but the momentum is weak.
Resistance level: 15780.00, 16585.00
Support level: 14610.00, 13660.00
The Australian dollar has gradually advanced after consolidating near its lowest level since November at 0.6370. Surprisingly, the uptick in U.S. CPI data didn’t exert downward pressure on the Aussie dollar. Market participants are now eagerly awaiting the release of Australia’s employment report, scheduled for today. Expectations are for a positive change in employment of 23,000 in August, which could increase the currency pair.
The AUD/USD pair’s bullish momentum seems sustainable after consolidating at the near 0.6370 range. The RSI is approaching the overbought zone while the MACD is hovering flat above the zero line, suggesting that bullish momentum is forming.
Resistance level: 0.6500,0.6610
Support level: 0.6370, 0.6200
Oil prices continued their upward trajectory, reaching a new 10-month high. Expectations of tightened global supply and concerns over supply disruptions in Libya outweighed worries about reduced demand in certain countries like China. The closure of Libyan oil export terminals due to a severe storm further supported oil prices. OPEC’s optimistic outlook on global oil demand growth in 2023 and 2024 adds to the bullish sentiment.
Oil prices are trading higher following the prior breakout above the previous resistance level. MACD has illustrated increasing bullish momentum. However, RSI is at 70, suggesting the commodity might enter the overbought territory.
Resistance level: 92.30, 95.80
Support level: 87.70, 84.45
Step into the world of trading with confidence today. Open a free PU Prime live CFD trading account now to experience real-time market action, or refine your strategies risk-free with our demo account.
This content is for educational and informational purposes only and should not be considered investment advice, a personal recommendation, or an offer to buy or sell any financial instruments.
This material has been prepared without considering any individual investment objectives, financial situations. Any references to past performance of a financial instrument, index, or investment product are not indicative of future results.
PU Prime makes no representation as to the accuracy or completeness of this content and accepts no liability for any loss or damage arising from reliance on the information provided. Trading involves risk, and you should carefully consider your investment objectives and risk tolerance before making any trading decisions. Never invest more than you can afford to lose.

Trade forex, indices, metal, and more at industry-low spreads and lightning-fast execution.
Sign up for a PU Prime Live Account with our hassle-free process.
Effortlessly fund your account with a wide range of channels and accepted currencies.
Access hundreds of instruments under market-leading trading conditions.
Please note the Website is intended for individuals residing in jurisdictions where accessing the Website is permitted by law.
Please note that PU Prime and its affiliated entities are neither established nor operating in your home jurisdiction.
By clicking the "Acknowledge" button, you confirm that you are entering this website solely based on your initiative and not as a result of any specific marketing outreach. You wish to obtain information from this website which is provided on reverse solicitation in accordance with the laws of your home jurisdiction.
Thank You for Your Acknowledgement!
Ten en cuenta que el sitio web está destinado a personas que residen en jurisdicciones donde el acceso al sitio web está permitido por la ley.
Ten en cuenta que PU Prime y sus entidades afiliadas no están establecidas ni operan en tu jurisdicción de origen.
Al hacer clic en el botón "Aceptar", confirmas que estás ingresando a este sitio web por tu propia iniciativa y no como resultado de ningún esfuerzo de marketing específico. Deseas obtener información de este sitio web que se proporciona mediante solicitud inversa de acuerdo con las leyes de tu jurisdicción de origen.
Thank You for Your Acknowledgement!