-
- Trading Platforms
- PU Prime App
- MetaTrader 5
- MetaTrader 4
- PU Copy Trading
- Web Trader
- PU Social
-
- Trading Conditions
- Account Types
- Spreads, Costs & Swaps
- Deposits & Withdrawals
- Fee & Charges
- Trading Hours

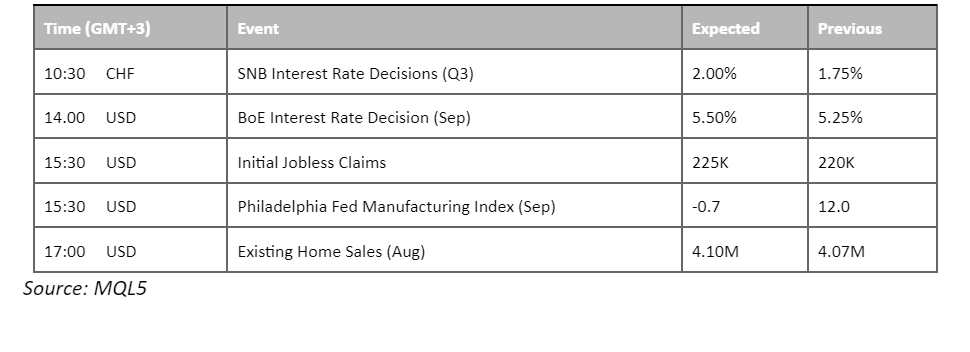
In the aftermath of the FOMC statement unveiled yesterday, financial markets fluctuated as investors dissected the nuanced signals emanating from the Fed’s leadership regarding its policy outlook. The dollar index held its ground firmly above the pivotal $105 level, exerting pressure on gold prices despite the Fed’s decision to temporarily halt its rate increases in September. Jerome Powell’s communication conveyed an unwavering stance on maintaining interest rates at a restrictive level until sustained inflation control is achieved. Concurrently, oil prices faced headwinds, influenced by the Fed’s hawkish tone and compounded by a lower-than-expected reduction in U.S. stockpiles. All eyes are currently trained on the Bank of England’s impending interest rate decision, amplified by lower-than-anticipated UK Consumer Price Index (CPI) figures that have fueled speculation of a potentially more dovish monetary policy stance from the British central bank.
Current rate hike bets on 1st November Fed interest rate decision:
Source: CME Fedwatch Tool
0 bps (68.0%) VS 25 bps (32%)


The US dollar staged an impressive rebound even as the Federal Reserve maintained its interest rates within the 5.25% to 5.50% range. Notably, hawkish stances among most Fed policymakers, with the anticipation of another rate hike before the year’s end, underpinned the greenback’s strength. The two-year Treasury yields surged to levels not witnessed in 17 years following the Fed’s announcement.
The Dollar Index is trading higher while currently testing the resistance level. MACD has illustrated diminishing bearish momentum, while RSI is at 58, suggesting the index might extend its gains after breakout since the RSI stays above the midline.
Resistance level: 105.40, 106.25
Support level: 104.25, 103.05
The gold market experienced a notable downturn following the Federal Reserve’s hawkish statements, with investors shifting their attention towards the resurgent US dollar. The optimistic economic outlook, fueled by the Fed’s upgraded GDP growth projections, prompted investors to reconsider their positions in favour of US investments, contributing to the gold market’s decline.
Gold prices are trading lower while currently testing the support level. MACD has illustrated increasing bearish momentum, while RSI is at 51, suggesting the commodity might extend its losses after breakout since the RSI retreated sharply from overbought territory.
Resistance level: 1950.00, 1975.00
Support level: 1930.00, 1910.00
The euro faced a significant decline as the US dollar continued to strengthen. Disappointing eurozone Consumer Price Index (CPI) figures fell short of expectations, impeding the euro’s ability to recover against the USD. Moreover, the Federal Reserve’s hawkish stance, announced yesterday, underscores the US central bank’s readiness to maintain interest rates at restrictive levels for an extended period in pursuit of its targeted inflation rate. This commitment has strengthened the dollar, particularly as the struggling eurozone economy lacks the necessary support for the European Central Bank (ECB) to implement an aggressive monetary tightening policy.
EUR/USD has a lower high price pattern, and the bullish momentum earlier seems to have vanished as the RSI and MACD both declined.
Resistance level:1.0700, 1.0760
Support level: 1.0640, 1.0540
The British Pound has recently dipped to levels not witnessed since May as the Fed’s hawkish posture lent strength to the dollar, even in the face of last night’s rate pause. The Fed’s message was resolute: U.S. interest rates will remain at their currently restrictive levels until inflation is controlled. Conversely, the Bank of England (BoE) is poised to release its interest rate decision today. The market, buoyed by a UK Consumer Price Index (CPI) that fell short of expectations, now anticipates a more dovish monetary policy stance from the British central bank.
The Pound Sterling has been breaking below its support level and is constantly trading below its long-term downtrend resistance level, suggesting a bearish signal for the Cable. The RSI and the MACD have been flowing in the lower region, echoing the bearish bias for the pair.
Resistance level: 1.2400, 1.2470
Support level: 1.2310, 1.2200
In the early Asian trading session, the New Zealand Dollar exhibited resilience, propelled by encouraging economic data. Statistics New Zealand reported a substantial improvement in Gross Domestic Product (GDP) for the last quarter, rising from a previous reading of 0.0% to a robust 0.90%, outperforming market expectations of 0.50%..
The Kiwi is trading higher following the prior rebound from the support level. However, MACD has illustrated increasing bearish momentum, while RSI is at 41, suggesting the pair might experience technical correction since the RSI stays below the midline.
Resistance level: 0.5985, 0.6015
Support level: 0.5925, 0.5890
The simultaneous rise in US Treasury yields and the Fed’s hawkish stance triggered further selloffs in the US equity market, underscoring the market’s sensitivity to interest rate dynamics. Despite a turbulent trading day, marked by rollercoaster volatility, market focus now pivots back to US economic data for further trading signals.
The Dow is trading lower while currently testing the support level. MACD has illustrated increasing bearish momentum, while RSI is at 44, suggesting the index might extend its losses after breakout since the RSI stays below the midline.
Resistance level: 34900.00, 35590.00
Support level: 34355.00, 33720.00
The USD/JPY pair shows resilience as it remains steadily above its recent consolidation range, signalling a bullish trend. Despite the Federal Reserve announcing a rate pause yesterday, the US dollar has strengthened due to a hawkish statement from the Fed’s chair. Investors have reacted by driving the dollar’s value higher. Today, all eyes are on the release of Japan’s Consumer Price Index (CPI), which could potentially serve as a catalyst for the USD/JPY pair to establish a clear direction.
USD/JPY is firmly traded at a high level, and the RSI as well as the MACD, have been constantly flowing at the upper region, suggesting a bullish bias for the pair.
Resistance level: 148.90, 151.45
Support level: 147.25, 145.00
Oil prices faced headwinds as the Federal Reserve signalled the likelihood of higher rates persisting. However, the oil market’s losses were contained by bullish inventory data. According to the Energy Information Administration (EIA), US Crude Oil Inventories showed a significant decrease, declining from 3.954 million barrels to -2.135 million barrels, surpassing market expectations.
Oil prices are trading lower following the prior retracement from the resistance level. MACD has illustrated increasing bearish momentum, while RSI is at 41, suggesting the commodity might extend its losses since the RSI retreated sharply from overbought territory.
Resistance level: 92.45, 95.80
Support level: 87.70, 84.45
Step into the world of trading with confidence today. Open a free PU Prime live CFD trading account now to experience real-time market action, or refine your strategies risk-free with our demo account.
This content is for educational and informational purposes only and should not be considered investment advice, a personal recommendation, or an offer to buy or sell any financial instruments.
This material has been prepared without considering any individual investment objectives, financial situations. Any references to past performance of a financial instrument, index, or investment product are not indicative of future results.
PU Prime makes no representation as to the accuracy or completeness of this content and accepts no liability for any loss or damage arising from reliance on the information provided. Trading involves risk, and you should carefully consider your investment objectives and risk tolerance before making any trading decisions. Never invest more than you can afford to lose.

Trade forex, indices, metal, and more at industry-low spreads and lightning-fast execution.
Sign up for a PU Prime Live Account with our hassle-free process.
Effortlessly fund your account with a wide range of channels and accepted currencies.
Access hundreds of instruments under market-leading trading conditions.
Please note the Website is intended for individuals residing in jurisdictions where accessing the Website is permitted by law.
Please note that PU Prime and its affiliated entities are neither established nor operating in your home jurisdiction.
By clicking the "Acknowledge" button, you confirm that you are entering this website solely based on your initiative and not as a result of any specific marketing outreach. You wish to obtain information from this website which is provided on reverse solicitation in accordance with the laws of your home jurisdiction.
Thank You for Your Acknowledgement!
Ten en cuenta que el sitio web está destinado a personas que residen en jurisdicciones donde el acceso al sitio web está permitido por la ley.
Ten en cuenta que PU Prime y sus entidades afiliadas no están establecidas ni operan en tu jurisdicción de origen.
Al hacer clic en el botón "Aceptar", confirmas que estás ingresando a este sitio web por tu propia iniciativa y no como resultado de ningún esfuerzo de marketing específico. Deseas obtener información de este sitio web que se proporciona mediante solicitud inversa de acuerdo con las leyes de tu jurisdicción de origen.
Thank You for Your Acknowledgement!