-
- Trading Platforms
- PU Prime App
- MetaTrader 5
- MetaTrader 4
- PU Copy Trading
- Web Trader
- PU Social
-
- Trading Conditions
- Account Types
- Spreads, Costs & Swaps
- Deposits & Withdrawals
- Fee & Charges
- Trading Hours

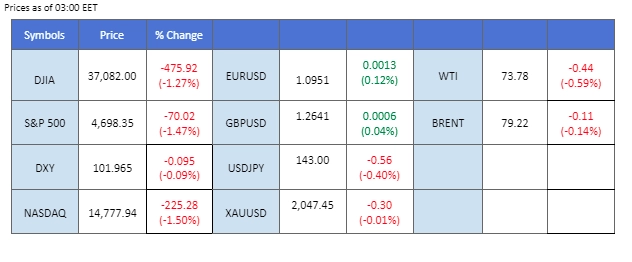
The U.S. equity markets experienced selling pressure yesterday, retreating from their record high levels. This downturn was accompanied by a rebound in the VIX index, known as the fear gauge, signalling an increase in panic selling—an apparent shift from its lowest level since 2019. Despite this market turbulence, the dollar index and gold prices traded steadily with minimal movement. However, the U.S. long-term treasury yield continued to decline, potentially exerting downward pressure on the dollar’s strength. Traders are eagerly awaiting the release of U.S. GDP data later today as they seek insights into the overall strength of the dollar. Additionally, oil prices registered their first decline of the week, attributed to the market redirecting attention to a jump in U.S. supply resulting from the Red Sea crisis.
Current rate hike bets on 31 January Fed interest rate decision:
Source: CME Fedwatch Tool
0 bps (89.0%) VS 25 bps (11%)


The Dollar Index, gauging the greenback against a basket of six major currencies, saw a modest uptick buoyed by a slew of encouraging economic indicators from the U.S. The Conference Board’s revelation of a surge in U.S. CB Consumer Confidence, climbing from 101.0 to 110.7 – surpassing market projections of 103.8 – underscores the prevailing optimism surrounding America’s economic trajectory. Additionally, U.S. Existing Home Sales surpassed expectations, registering a rise from 3.79M to 3.82M against a forecast of 3.78M.
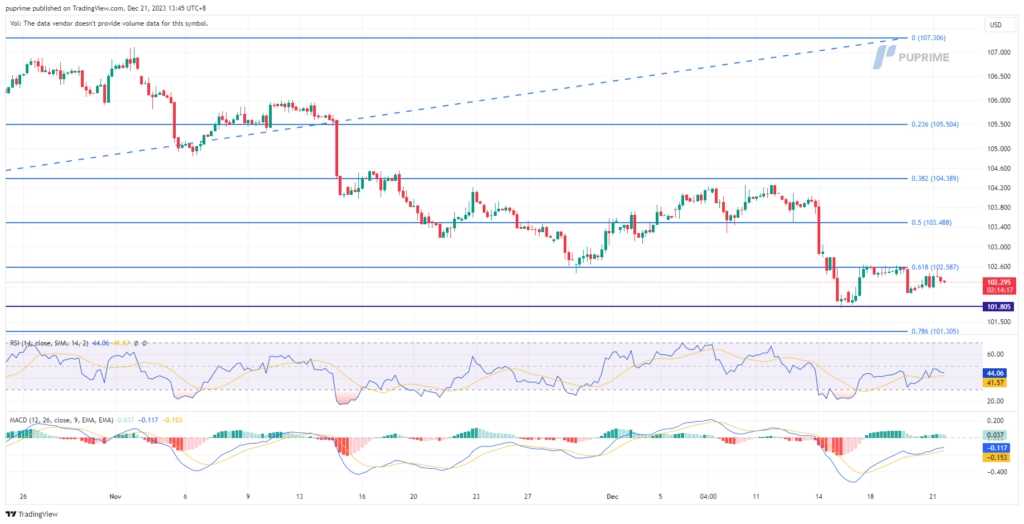
The Dollar Index is trading higher while currently testing the resistance level. MACD has illustrated increasing bullish momentum, while RSI is at 45, suggesting the index might extend its gains after breakout since the RSI rebounded sharply from oversold territory.
Resistance level: 102.60, 103.50
Support level: 101.80, 101.30
Gold prices exhibited muted movement but encountered bearish headwinds in the wake of robust U.S. economic data releases. The dollar’s heightened allure, bolstered by the optimistic economic indicators, somewhat overshadowed gold’s appeal among investors. As the week unfolds, market watchers remain on high alert for forthcoming U.S. economic data, notably the GDP, Initial Jobless Claims, and PCE Report, which could delineate gold’s near-term trajectory.
Gold prices are trading lower following the prior retracement from the resistance level. MACD has illustrated increasing bearish momentum, while RSI is at 55, suggesting the commodity might extend its losses since the RSI retreated sharply from overbought territory.
Resistance level: 2045.00, 2095.00
Support level: 1985.00, 1925.00
Pound Sterling witnessed a pronounced decline, reverberating from a disappointing inflation report emanating from the United Kingdom. The Office for National Statistics’ revelation of the UK Consumer Price Index (CPI) contracting from 4.6% to 3.90% – a figure markedly below market consensus of 4.30% – has intensified speculation around imminent rate adjustments by the Bank of England in the upcoming year. This unexpected deflationary trend, the most significant dip since September 2021, underscores mounting pressures on the UK’s monetary policy landscape
GBP/USD is trading lower while currently testing the support level. MACD has illustrated increasing bearish momentum, while RSI is at 43, suggesting the pair might extend its losses after breakout since the RSI stays below the midline.
Resistance level: 1.2729, 1.2815
Support level: 1.2630, 1.2528
The Euro exhibited quiet trading against the subdued U.S. dollar, with the pair’s price movement remaining sideways throughout the day. The Eurozone’s Consumer Price Index (CPI) met market expectations, indicating that economic inflation is being effectively managed. Conversely, the U.S. dollar maintained its position, showing little change as traders awaited key economic indicators. The standstill in the dollar’s movement comes ahead of the release of U.S. Gross Domestic Product (GDP) and Personal Consumption Expenditures (PCE) readings later in the week. These data points are anticipated to carry significant weight and potentially impact the strength of the U.S. dollar.
The EUR/USD Pair traded sideways, awaiting a catalyst for the pair to pick a direction. The RSI and the MACD are flowing sideways at a higher level, suggesting the bullish momentum remains intact with the pair.
Resistance level: 1.1040, 1.1140
Support level: 1.0866, 1.0775
The USD/JPY pair continues to trade below its long-term downtrend resistance level, indicating a prevailing bearish bias. The subdued U.S. long-term treasury yield adds to the downward pressure on the U.S. dollar. Investors are closely watching the Japanese inflation gauge, scheduled for release on Friday, as it is expected to provide insights into the strength of the Yen.
USD/JPY is trading lower following the prior retracement level and remains below its long-term downtrend resistance level. The RSI has declined to near the 50 level while the MACD eases near the zero line, suggesting the bullish momentum vanishes.
Resistance level: 143.78, 145.30
Support level: 141.60, 138.88
The Dow Jones Industrial Average retraced and experienced a drop of over 450 points yesterday as selling pressure intensified. Profit-taking sentiment became more pronounced in the U.S. equity market, particularly after reaching a new all-time high earlier in the week. The Wall Street fear gauge, VIX index, rebounded significantly from its lowest level, indicating a strong resurgence of panic selling sentiment. Despite the recent pullback, a long-term bullish bias still persists within the U.S. equity market.
The Dow had a technical retracement after a long bullish run since November, but the index remained trading within the uptrend channel. The RSI had broken below the overbought zone for the first time in nearly a month while the MACD continued to flow higher, suggesting the bullish momentum remains strong.
Resistance level: 37650, 39010
Support level: 36570,35730
Crude oil prices experienced a slight downturn, driven by bearish sentiment stemming from an unexpected surge in the U.S. crude inventories. The Energy Information Administration’s data revealed a substantial increase of 2.909M barrels, significantly diverging from economists’ anticipations of a 2.283M decline. This stark rise in inventories amplifies concerns of subdued oil demand juxtaposed against an ample supply backdrop, exerting downward pressure on the commodity.
Oil prices are trading lower following the prior retracement from the resistance level. MACD has illustrated increasing bearish momentum, while RSI is at 57, suggesting the commodity might extend its losses toward support level since the RSI retreated sharply from overbought territory.
Resistance level: 74.60, 78.65
Support level: 71.75, 68.00
Step into the world of trading with confidence today. Open a free PU Prime live CFD trading account now to experience real-time market action, or refine your strategies risk-free with our demo account.
This content is for educational and informational purposes only and should not be considered investment advice, a personal recommendation, or an offer to buy or sell any financial instruments.
This material has been prepared without considering any individual investment objectives, financial situations. Any references to past performance of a financial instrument, index, or investment product are not indicative of future results.
PU Prime makes no representation as to the accuracy or completeness of this content and accepts no liability for any loss or damage arising from reliance on the information provided. Trading involves risk, and you should carefully consider your investment objectives and risk tolerance before making any trading decisions. Never invest more than you can afford to lose.

Trade forex, indices, metal, and more at industry-low spreads and lightning-fast execution.
Sign up for a PU Prime Live Account with our hassle-free process.
Effortlessly fund your account with a wide range of channels and accepted currencies.
Access hundreds of instruments under market-leading trading conditions.
Please note the Website is intended for individuals residing in jurisdictions where accessing the Website is permitted by law.
Please note that PU Prime and its affiliated entities are neither established nor operating in your home jurisdiction.
By clicking the "Acknowledge" button, you confirm that you are entering this website solely based on your initiative and not as a result of any specific marketing outreach. You wish to obtain information from this website which is provided on reverse solicitation in accordance with the laws of your home jurisdiction.
Thank You for Your Acknowledgement!
Ten en cuenta que el sitio web está destinado a personas que residen en jurisdicciones donde el acceso al sitio web está permitido por la ley.
Ten en cuenta que PU Prime y sus entidades afiliadas no están establecidas ni operan en tu jurisdicción de origen.
Al hacer clic en el botón "Aceptar", confirmas que estás ingresando a este sitio web por tu propia iniciativa y no como resultado de ningún esfuerzo de marketing específico. Deseas obtener información de este sitio web que se proporciona mediante solicitud inversa de acuerdo con las leyes de tu jurisdicción de origen.
Thank You for Your Acknowledgement!