


-
- Trading Platforms
- PU Prime App
- MetaTrader 5
- MetaTrader 4
- PU Copy Trading
- Web Trader
- PU Social
-
- Trading Conditions
- Account Types
- Spreads, Costs & Swaps
- Deposits & Withdrawals
- Fee & Charges
- Trading Hours


EN
3 August 2023,06:38
Daily Market Analysis
3 August 2023, 06:38


Last night, the financial market witnessed significant turbulence as Fitch’s downgrade of U.S. treasuries sent shockwaves. U.S. equity markets experienced a sharp decline, with Nasdaq leading the losses with a plunge of over 2%. Simultaneously, the U.S. 10-year bond yield surged to its highest level in 2023, bolstering the dollar’s strength. The robust ADP Nonfarm Employment data supported the greenback’s rise, which far surpassed market expectations at 324k, underscoring the tightness in the labor market. Despite a substantial decline in U.S. crude inventories, oil prices faced selling pressure as investors opted to take-profit amid uncertainties surrounding the U.S. economy following the credit rating downgrade.
Current rate hike bets on 26th July Fed interest rate decision:
Source: CME Fedwatch Tool
0 bps (0.2%) VS 25 bps (99.8%)


The U.S. dollar demonstrated robust strength in response to positive economic indicators, with the ADP Nonfarm Employment Change exceeding market expectations at 324K, far surpassing the anticipated 189K. These encouraging figures are a testament to the resilience of the US jobs market, even amid an extended Federal Reserve rate hike decision.
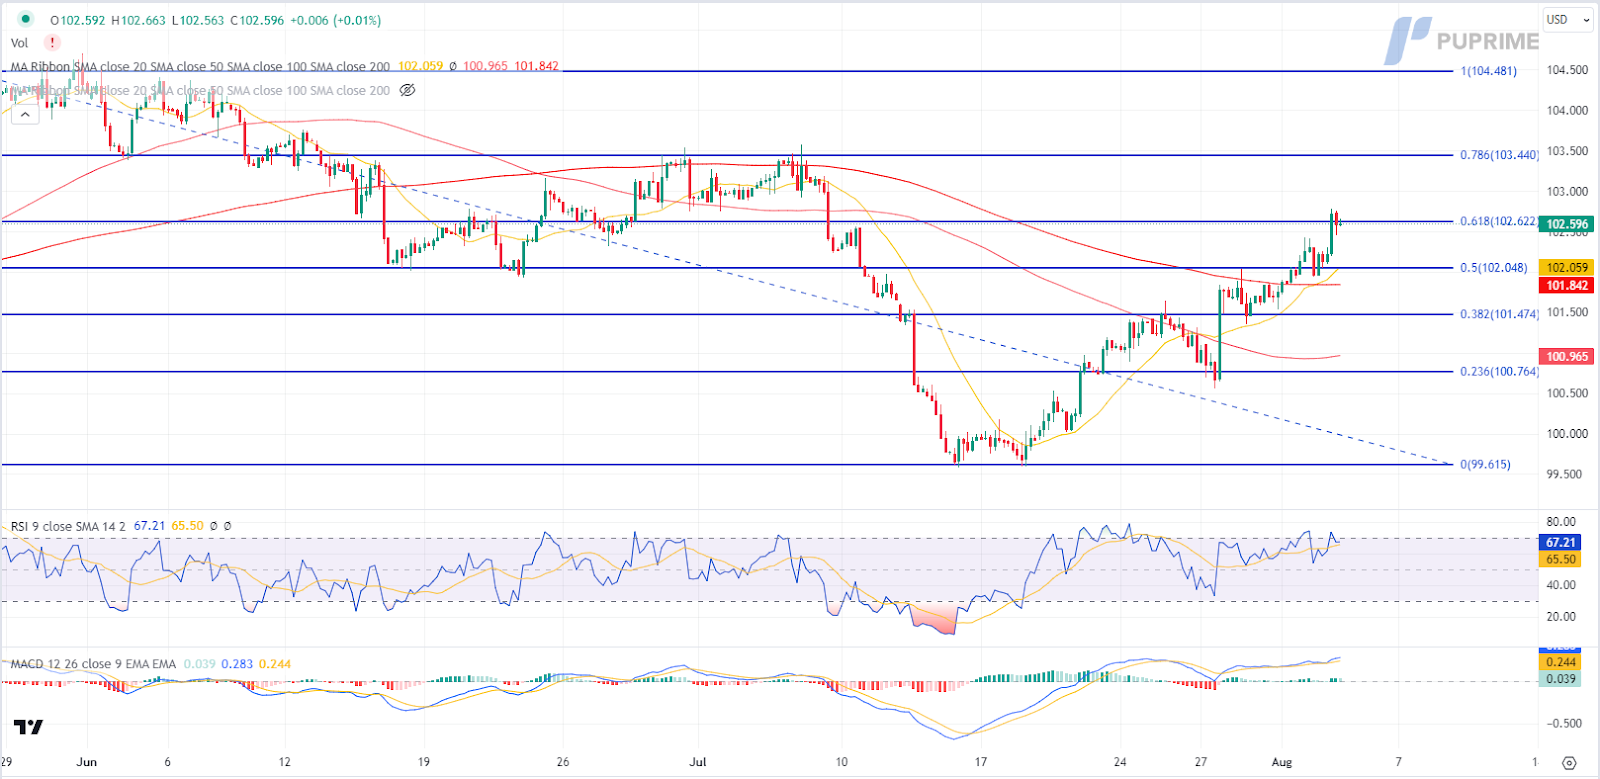
The dollar index is trading higher while currently testing the resistance level. However, MACD has illustrated diminishing bullish momentum, while RSI is at 67, suggesting the index might enter overbought territory.
Resistance level: 102.60, 103.45
Support level: 102.05, 101.45
The downgrading of U.S. treasury bonds triggered aggressive selloffs by investors, leading to higher yields. The rising U.S. Treasury yields had further increased the market demand on the U.S. dollar, which weighed on the attractiveness of gold as an investment option. Meanwhile, U.S. Treasury Secretary Janet Yellen’s disagreement with Fitch’s downgrade brought some relief to investors, leading to a slight rebound in risk appetite, but the overall sentiment remained cautious.
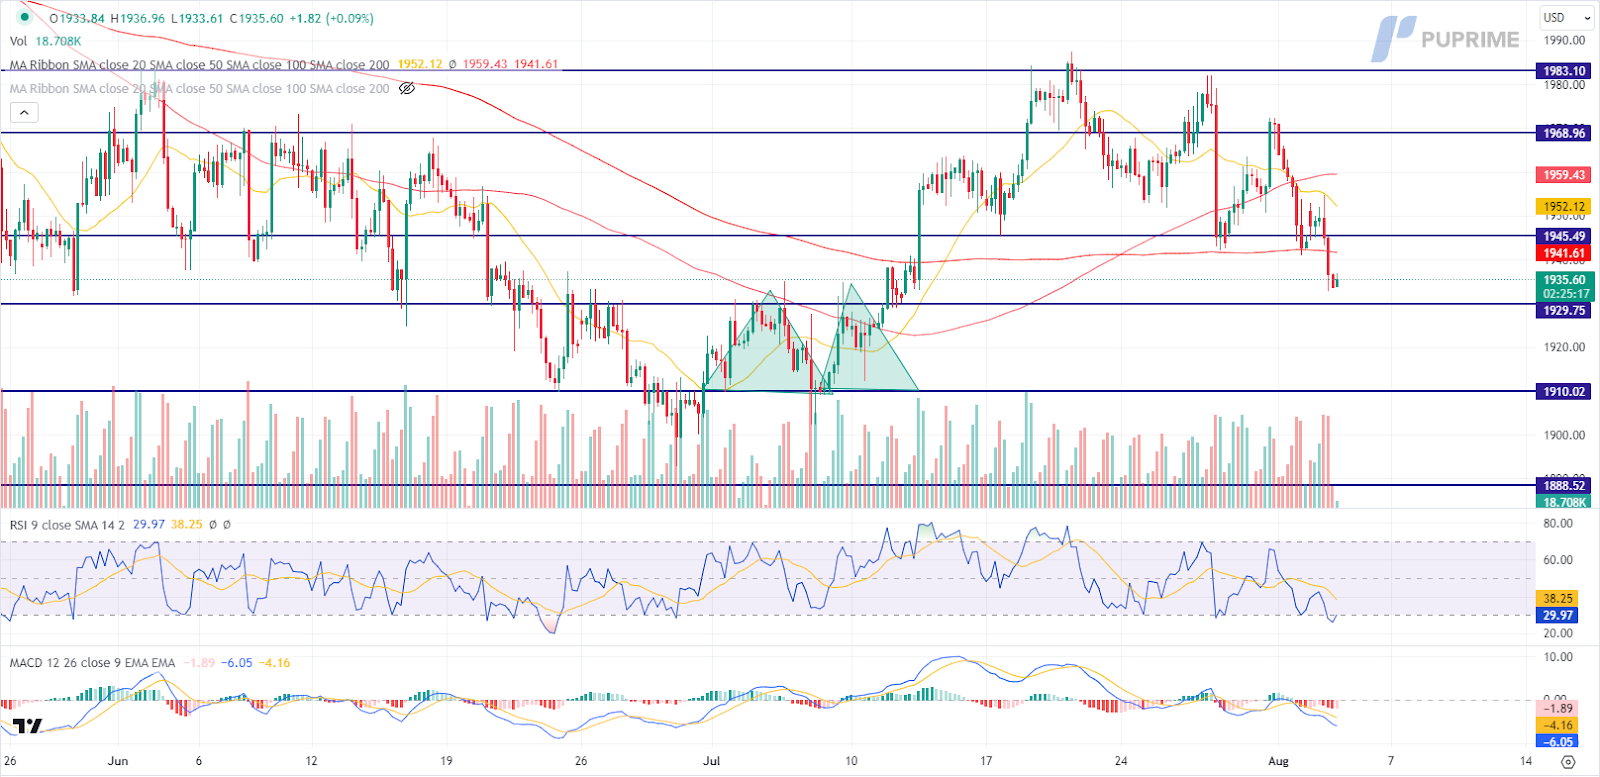
Gold prices are trading lower following the prior breakout below the previous support level. However, MACD has illustrated diminishing bearish momentum, while RSI is at 30, suggesting the commodity might enter oversold territory.
Resistance level: 1945.00, 1970.00
Support level: 1930.00, 1910.00
The U.S. dollar continued its ascent as the yield on U.S. long-term treasuries reached its peak for 2023. This surge in treasuries yield can be attributed primarily to Fitch’s downgrade of the U.S. credit rating, which heightened market concerns. Additionally, the release of the ADP Nonfarm employment data yesterday caught many by surprise, revealing a much higher figure of 324k compared to the forecasted 189k. This robust data suggests that the U.S. labour market remains tight and may prompt the Federal Reserve to adopt a more hawkish monetary policy, potentially bolstering the dollar further.
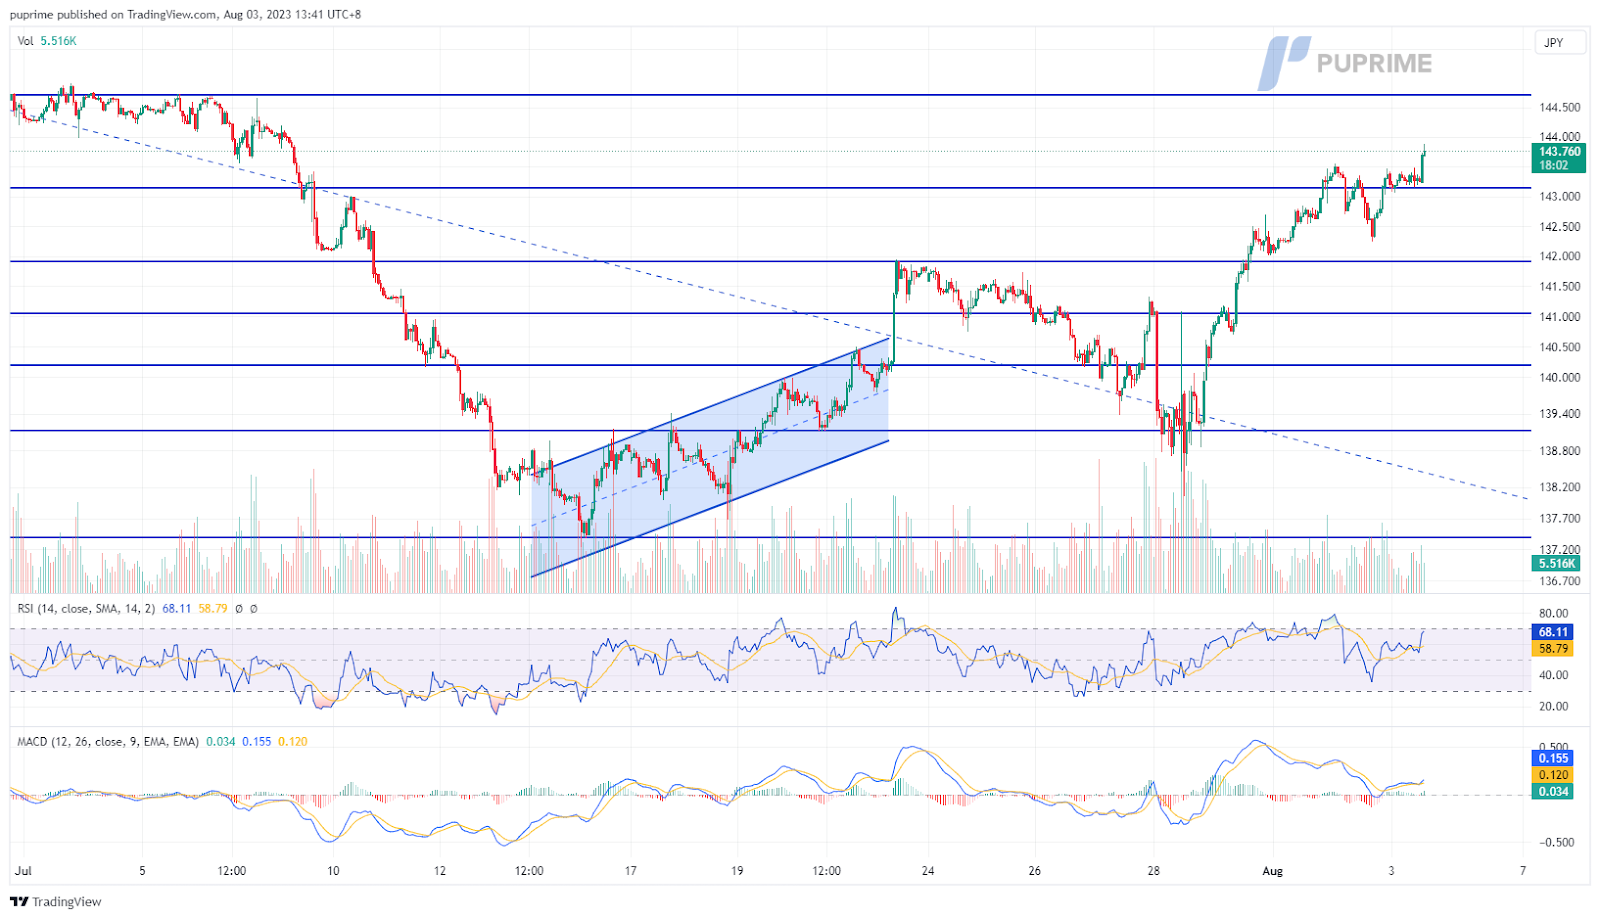
The USD/JPY pair has been steadily supported at the level above 143 indicating that the dollar has been strong against the Japanese Yen. The RSI is moving toward the overbought zone while the MACD continues to climb suggesting the bullish momentum is strong.
Resistance level: 144.75, 146.00
Support level: 143.10, 141.90
The AUD/USD pair remains in negative territory, extending its decline for the past two days, and hitting its lowest levels since early June. The persistent downtrend is fueled by the dovish stance of the Reserve Bank of Australia (RBA), which opted to maintain interest rates instead of raising them, coupled with disappointing economic data from China, affecting the Chinese-proxy Aussie. Moreover, the Aussie Dollar’s losses are exacerbated by waning risk appetite in the global financial market, as Fitch Ratings’ downgrade of the US government credit rating sparks concerns about the potential of a US default. Investors are cautious, and the currency pair continues to face downward pressure amidst these challenging economic conditions.
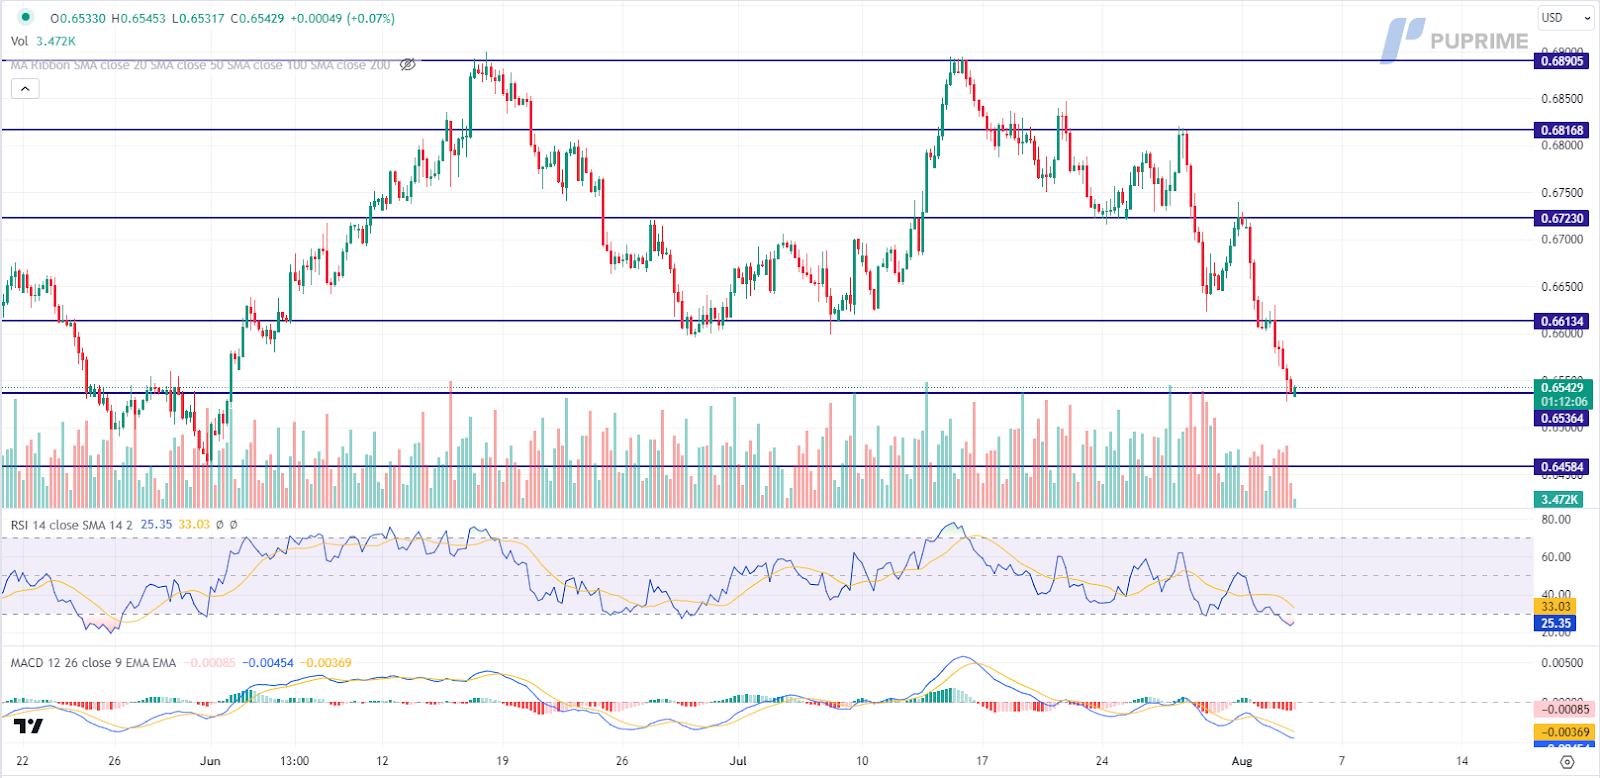
The Aussie dollar is trading lower while currently testing the support level. However, MACD has illustrated diminishing bearish momentum, while RSI is at 25, suggesting the pair might enter oversold territory.
Resistance level: 0.6615, 0.6725
Support level: 0.6535, 0.6460
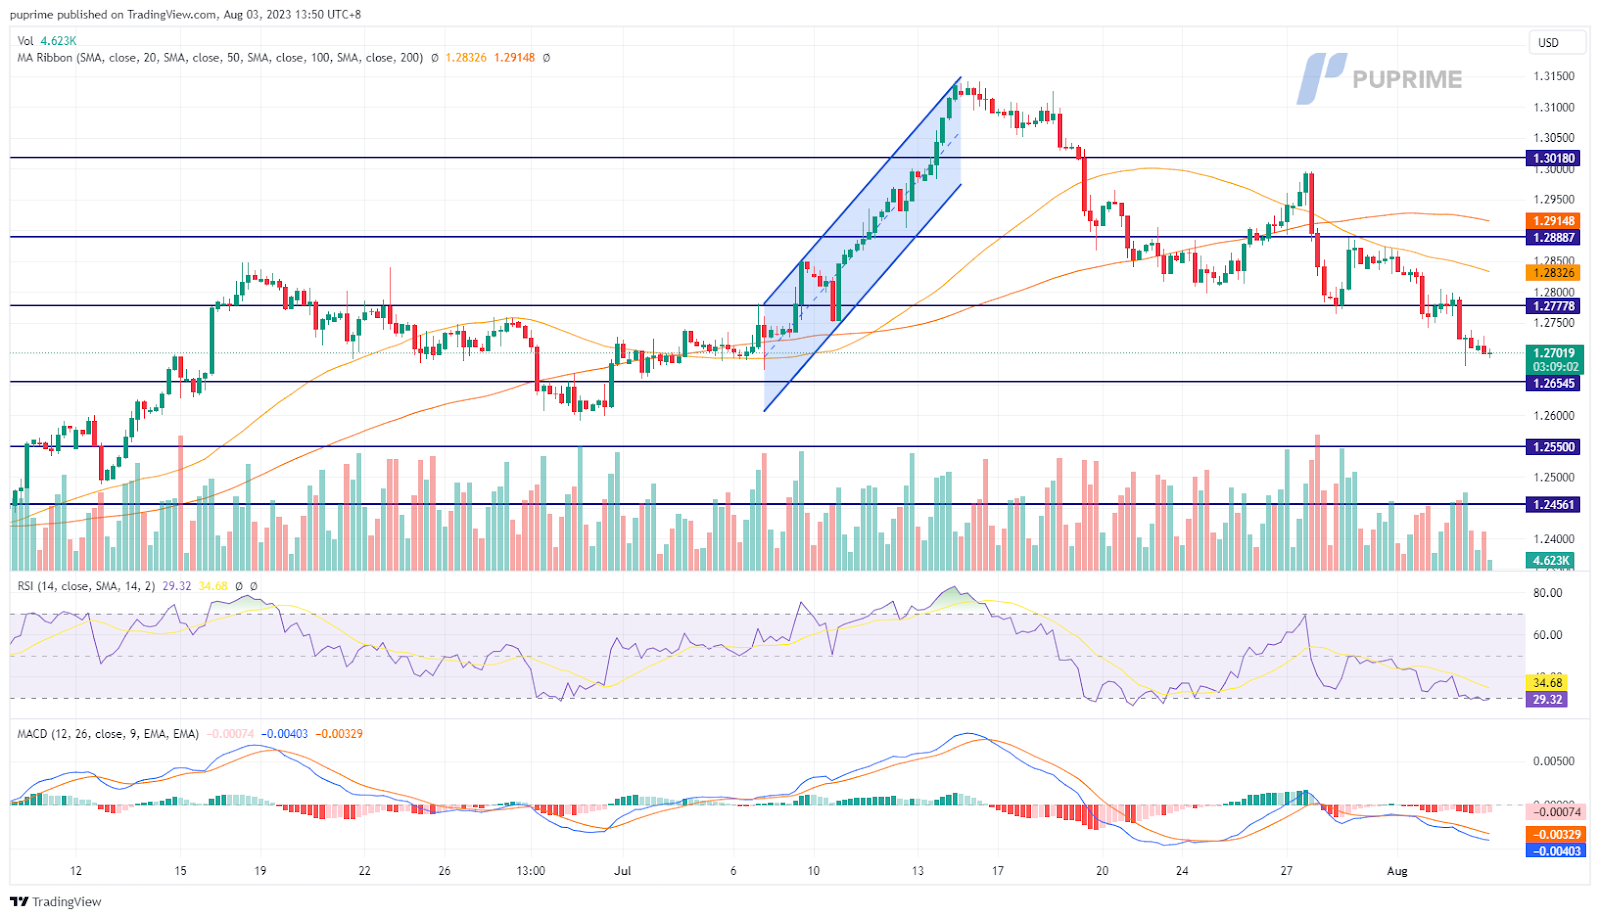
The British pound remains sluggish against the dollar ahead of the Bank of England’s interest rate decision, scheduled to be announced later today (3rd August). The surge in U.S. long-term bond yields, coupled with the tight labour market indicated by the latest ADP Nonfarm employment data, has propelled the dollar towards the $103 mark. However, indecision regarding whether the BoE will implement a 25 bps or 50 bps rate hike has kept the Cable trading on the sidelines.
Sterling continued to trade in a downtrend for the 3rd continuous week and exhibited a sluggish trend for the Cable. The RSI is on the brink of falling into the oversold zone while the MACD continues to move downward suggesting the Cable is trading in a bearish momentum.
Resistance level: 1.2778, 1.2888
Support level: 1.2650, 1.2550

The U.S. equity market, including S&P 500, experienced a significant decline for a second consecutive day, as worries mounted over the potential implications of the downgrade on debt borrowing progress. The technology index was the worst performer among the 11 major S&P sectors, dropping by 2.6%. Investors expressed concerns over the potential impact of the US credit rating downgrade and the rising interest rates on the profit margins of US corporations due to higher interest expenses in the future. These factors contributed to the overall negative sentiment in the technology sector.
S&P 500 is trading lower following the prior retracement from the resistance level. MACD has illustrated increasing bearish momentum, while RSI is at 54, suggesting the index to extend its losses since the RSI retraced sharply from overbought territory.
Resistance level: 4605.00, 4790.00
Support level: 4380.00, 4205.00

The oil market experienced a more than 2% drop following a five-week rally, as uncertainties in the global financial market heightened ahead of crucial data releases and bond downgrading news. Investors opted to take profits amid the prevailing uncertainties. Additionally, the appreciation of the US Dollar contributed to the oil market becoming relatively more expensive, dampening its appeal for dollar-denominated commodities.
Oil prices are trading lower following the prior retracement from the resistance level. MACD has illustrated increasing bearish momentum, However, RSI is at 36, suggesting the commodity might enter oversold territory.
Resistance level: 80.55, 83.20
Support level: 77.30, 73.70
Step into the world of trading with confidence today. Open a free PU Prime live CFD trading account now to experience real-time market action, or refine your strategies risk-free with our demo account.
This content is for educational and informational purposes only and should not be considered investment advice, a personal recommendation, or an offer to buy or sell any financial instruments.
This material has been prepared without considering any individual investment objectives, financial situations. Any references to past performance of a financial instrument, index, or investment product are not indicative of future results.
PU Prime makes no representation as to the accuracy or completeness of this content and accepts no liability for any loss or damage arising from reliance on the information provided. Trading involves risk, and you should carefully consider your investment objectives and risk tolerance before making any trading decisions. Never invest more than you can afford to lose.

Trade forex, indices, metal, and more at industry-low spreads and lightning-fast execution.
Sign up for a PU Prime Live Account with our hassle-free process.
Effortlessly fund your account with a wide range of channels and accepted currencies.
Access hundreds of instruments under market-leading trading conditions.
Trading Platforms
Learn
About PU Prime
Corporate

Please note the Website is intended for individuals residing in jurisdictions where accessing the Website is permitted by law.
Please note that PU Prime and its affiliated entities are neither established nor operating in your home jurisdiction.
By clicking the "Acknowledge" button, you confirm that you are entering this website solely based on your initiative and not as a result of any specific marketing outreach. You wish to obtain information from this website which is provided on reverse solicitation in accordance with the laws of your home jurisdiction.
Thank You for Your Acknowledgement!
Ten en cuenta que el sitio web está destinado a personas que residen en jurisdicciones donde el acceso al sitio web está permitido por la ley.
Ten en cuenta que PU Prime y sus entidades afiliadas no están establecidas ni operan en tu jurisdicción de origen.
Al hacer clic en el botón "Aceptar", confirmas que estás ingresando a este sitio web por tu propia iniciativa y no como resultado de ningún esfuerzo de marketing específico. Deseas obtener información de este sitio web que se proporciona mediante solicitud inversa de acuerdo con las leyes de tu jurisdicción de origen.
Thank You for Your Acknowledgement!