-
- Trading Platforms
- PU Prime App
- MetaTrader 5
- MetaTrader 4
- PU Copy Trading
- Web Trader
- PU Social
-
- Trading Conditions
- Account Types
- Spreads, Costs & Swaps
- Deposits & Withdrawals
- Fee & Charges
- Trading Hours

*The Senate passes a bipartisan stopgap bill during a rare Sunday session, ending the record 41-day government shutdown and funding operations.
*Nasdaq Composite jumps over 2% as Nvidia gains 5.8% on renewed AI optimism, while Palantir surges 8.8% after reporting 30% YoY revenue growth in Q3.
*VIX retreats to 17.6 from 22.72, signaling improved risk appetite—though the temporary funding fix leaves long-term fiscal uncertainty intact.
Market Summary:
The record 41-day U.S. government shutdown appears set to conclude after the Senate secured a bipartisan agreement during a rare Sunday session on November 9, passing a stopgap measure to fund government operations through January 2026. Equity markets responded positively, with all three major indices closing higher in the last session.
The Nasdaq Composite outperformed, rallying over 2%, propelled by strong performances in key technology constituents. Nvidia surged 5.8%, benefiting from renewed AI optimism amid the clearing of political uncertainty, while Palantir advanced 8.8% following its Q3 earnings report which showed accelerating revenue growth of 30% YoY, driven by AI-powered government and enterprise contracts.
The CBOE Volatility Index (VIX) retreated to 17.6 from its weekly peak of 22.72, indicating a notable improvement in market sentiment and risk appetite that could provide further near-term support for equity indices.
Investor Considerations: While the resolution removes an immediate market overhang, investors should note this represents a temporary funding fix. The underlying legislative conflict over Affordable Care Act subsidies remains unresolved, establishing a potential fiscal cliff in early 2026 and preserving political uncertainty as a market factor in the medium term.
Technical Analysis

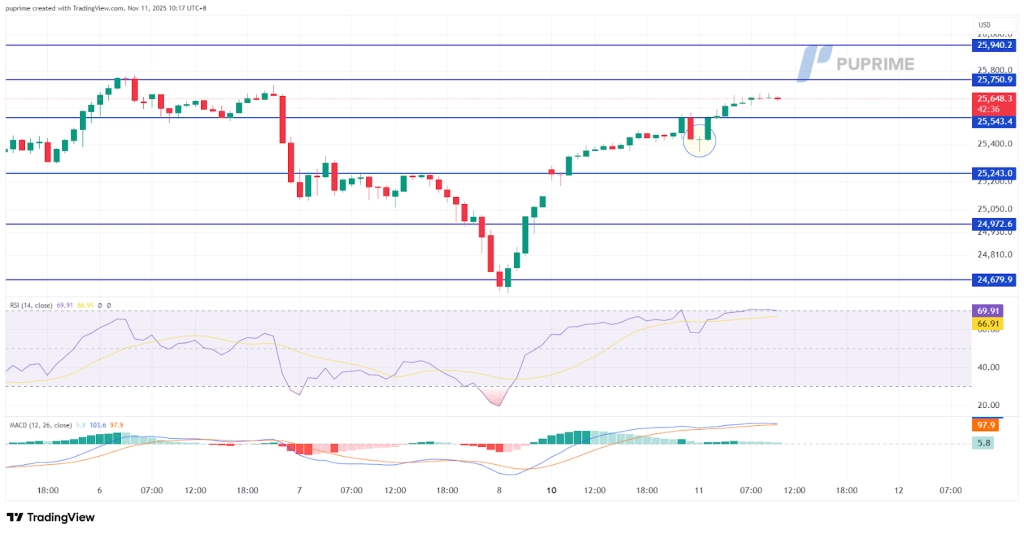
The Nasdaq Composite has demonstrated a substantial recovery, erasing all losses incurred during the previous week and rallying over 4% from its recent low of 24,610.00. This strong rebound has propelled the index to weekly highs, supported by the formation of a morning star candlestick pattern—a reliable technical indicator suggesting a potential bullish reversal and underlying buying strength.
The index now faces a critical technical test at the 25,540 support level. A sustained hold above this threshold would confirm the resilience of the current upward momentum and support the case for continued strength within the prevailing bullish trajectory.
Momentum indicators reinforce the positive near-term outlook. The Relative Strength Index (RSI) has advanced into overbought territory, reflecting strong buying pressure, while the Moving Average Convergence Divergence (MACD) continues to trend higher after completing a bullish crossover above its zero line. This alignment suggests building bullish momentum that could support further gains, with the next significant resistance level projected near the 26,000 psychological handle. Traders should monitor for potential consolidation as the RSI indicates near-term overbought conditions, though the overall technical structure remains constructive.
Resistance level: 25,750.00, 25,940.00
Support level:25,545.00, 25,250.00

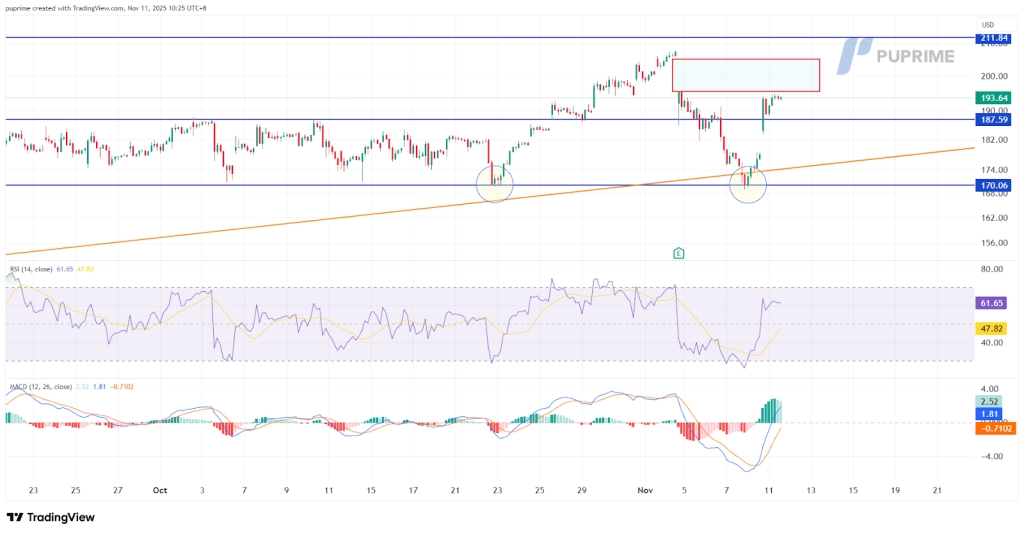
Palantir (PLTR) is exhibiting a constructive technical setup following a pullback from its all-time high of $207.51. The stock has established a significant support base, forming a double-bottom pattern at the key $170.00 level—a classic reversal signal. The subsequent 14% rebound from this support confirms a near-term bullish trend reversal is underway.
The immediate technical challenge for PLTR lies overhead, where a price gap formed during the initial decline acts as a formidable resistance zone. A decisive breakout and daily close above this gap would represent a powerful bullish signal, likely confirming the resumption of the primary uptrend and opening a path toward retesting its prior highs.
Momentum indicators currently present a neutral near-term bias. The Relative Strength Index (RSI) is consolidating near its mid-point, and the Moving Average Convergence Divergence (MACD) is hovering around its zero line. This suggests a period of equilibrium between buyers and sellers as the market digests recent gains. The next sustained directional move will likely be determined by the stock’s ability to overcome the gap resistance; a failure to do so could see the shares consolidate further within the newly established range between $170 support and gap resistance.
Resistance level: 211.85, 234.70
Support level:187.30, 170.40

Trade forex, indices, metal, and more at industry-low spreads and lightning-fast execution.
Sign up for a PU Prime Live Account with our hassle-free process.
Effortlessly fund your account with a wide range of channels and accepted currencies.
Access hundreds of instruments under market-leading trading conditions.

Please note the Website is intended for individuals residing in jurisdictions where accessing the Website is permitted by law.
Please note that PU Prime and its affiliated entities are neither established nor operating in your home jurisdiction.
By clicking the "Acknowledge" button, you confirm that you are entering this website solely based on your initiative and not as a result of any specific marketing outreach. You wish to obtain information from this website which is provided on reverse solicitation in accordance with the laws of your home jurisdiction.
Thank You for Your Acknowledgement!
Ten en cuenta que el sitio web está destinado a personas que residen en jurisdicciones donde el acceso al sitio web está permitido por la ley.
Ten en cuenta que PU Prime y sus entidades afiliadas no están establecidas ni operan en tu jurisdicción de origen.
Al hacer clic en el botón "Aceptar", confirmas que estás ingresando a este sitio web por tu propia iniciativa y no como resultado de ningún esfuerzo de marketing específico. Deseas obtener información de este sitio web que se proporciona mediante solicitud inversa de acuerdo con las leyes de tu jurisdicción de origen.
Thank You for Your Acknowledgement!