
-
- Trading Platforms
- PU Prime App
- MetaTrader 5
- MetaTrader 4
- PU Copy Trading
- Web Trader
- PU Social
-
- Trading Conditions
- Account Types
- Spreads, Costs & Swaps
- Deposits & Withdrawals
- Fee & Charges
- Trading Hours
EN
Published: 30 June 2025,06:06
Chart The Market

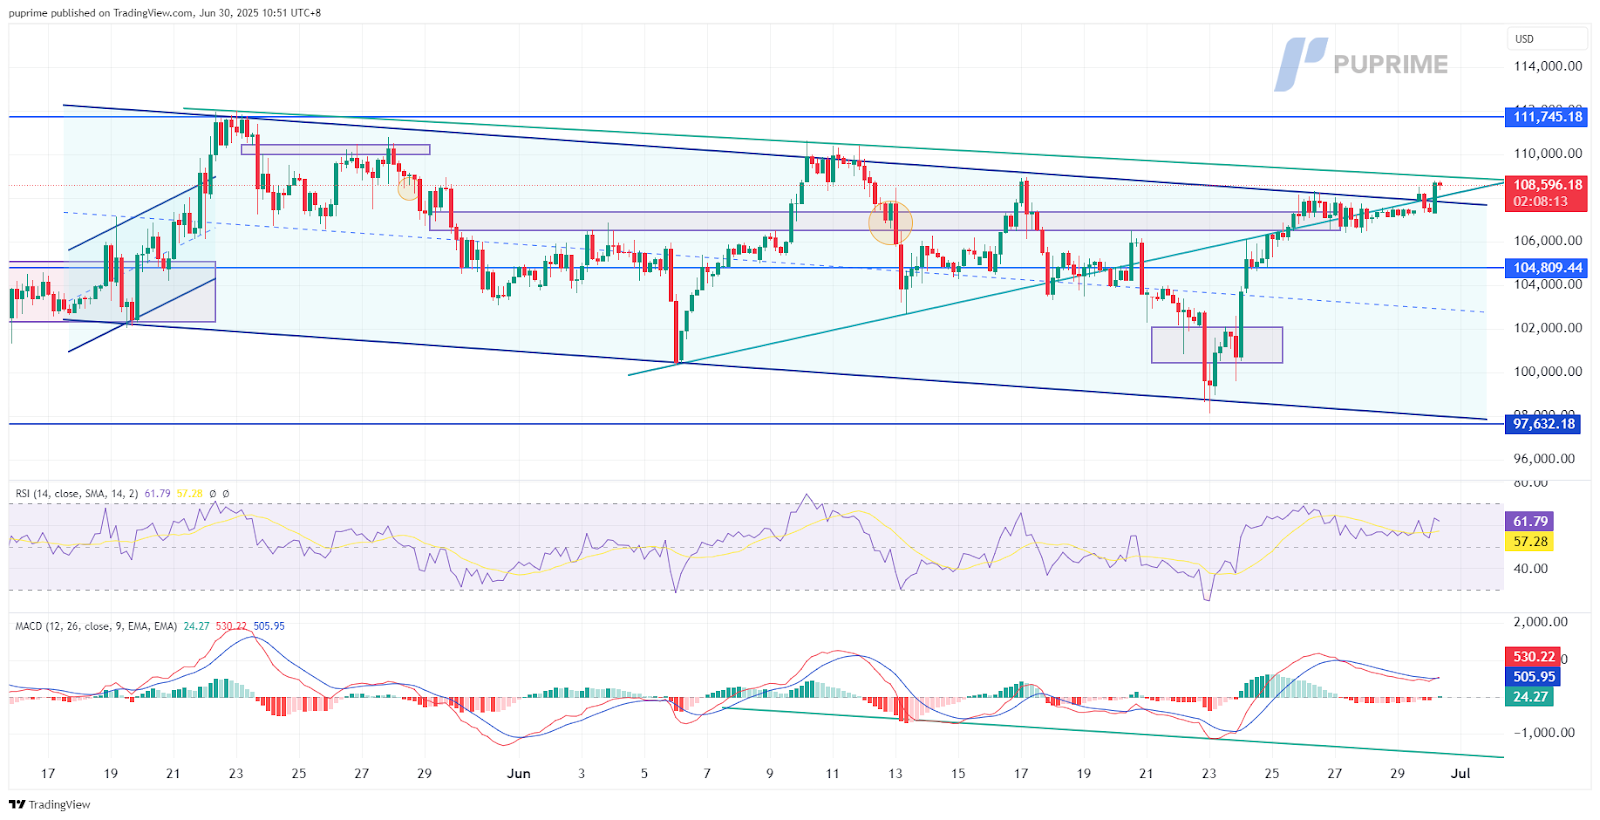
BTC, H4:
Bitcoin has staged a decisive technical breakout, shattering its long-term downtrend with a powerful surge past the critical $108,000 resistance level. This significant price action marks a potential turning point for the cryptocurrency, as it not only invalidates the previous bearish structure but also demonstrates remarkable resilience after successfully defending the psychologically important $100,000 support zone. The subsequent 10% rebound from this liquidity pool exemplifies classic bullish market behavior, where strategic buyers stepped in to reverse what appeared to be weakening momentum.
The importance of this breakout extends beyond just price levels. By conclusively breaking through the $107,000-$108,000 resistance cluster that had repeatedly capped previous rallies, Bitcoin has effectively rewritten its technical narrative. This isn’t merely a short-term spike, but rather a fundamental shift in market structure supported by strong trading volume—a crucial factor that distinguishes genuine breakouts from false signals. The move carries particular weight as it occurred after an extended period of consolidation, suggesting accumulated energy finally found release in a meaningful directional move.
Supporting this bullish case, momentum indicators paint an encouraging picture without yet flashing warning signs. The Relative Strength Index (RSI), while elevated, remains shy of overbought territory, indicating room for further upside before the market becomes excessively extended. Simultaneously, the Moving Average Convergence Divergence (MACD) shows early signs of rebounding on daily charts, hinting at accelerating positive momentum at this pivotal juncture. These technical signals combine to suggest that Bitcoin’s upward trajectory may have staying power rather than representing a fleeting spike.
Resistance Levels: 111,745.00, 117,200.00
Support Levels: 104,800.00, 97,630.00
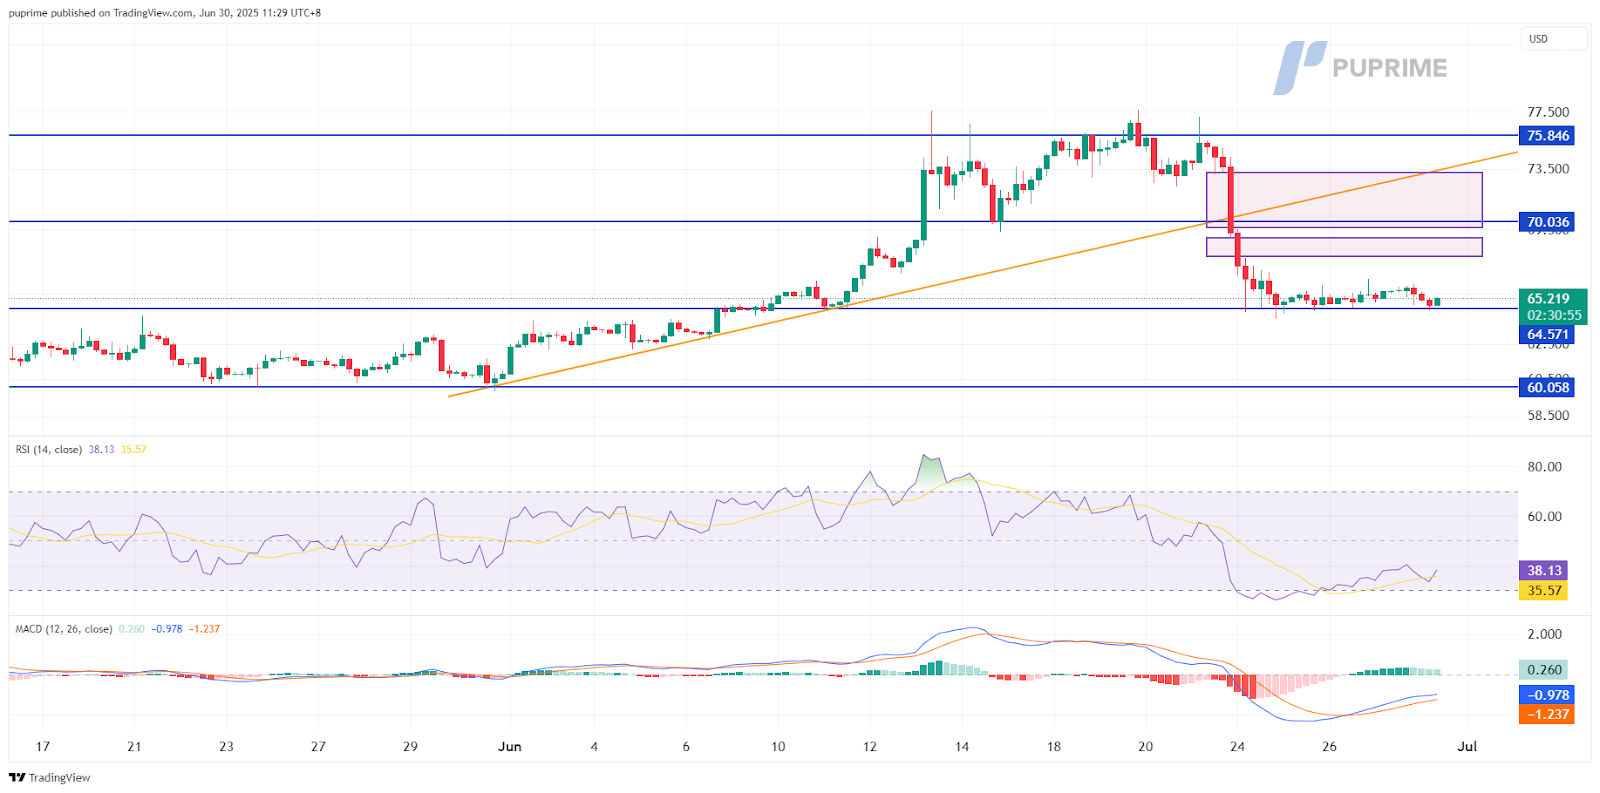
USOIL, H4
Crude oil markets have experienced a dramatic reversal of fortune, with prices plunging more than 15% from recent highs above $77 to test critical support near $64.65. This sharp correction reflects shifting fundamental market dynamics, but the subsequent stabilization suggests sellers may be exhausting their momentum. The commodity now finds itself at a technical inflection point where oversold conditions and key chart patterns hint at a potential recovery phase.
The rapid descent created two distinct Fair Value Gaps (FVGs) on the price chart—areas where violent downward moves left unfilled space that often attracted prices back to “fill the void.” These gaps now serve as magnetic zones that could pull oil prices higher in a technical rebound. The $64.65 support level has proven resilient through multiple tests, forming a base from which buyers could stage a countermove. This price action resembles previous instances where crude found footing after similar precipitous declines.
Momentum indicators tell a compelling story of potential reversal. The Relative Strength Index (RSI) has dipped into oversold territory—a condition that has frequently preceded bounce attempts in oil’s historical patterns. More significantly, the Moving Average Convergence Divergence (MACD) has formed a bullish golden cross at depressed levels, with the MACD line crossing above its signal line near the zero baseline. This development typically signals waning downward momentum and often precedes trend reversals when occurring after extreme selloffs.
The coming sessions will prove critical in determining whether this stabilization represents mere consolidation before another leg lower or the foundation for a more meaningful recovery. Market participants should monitor whether the MACD confirmation develops with strengthening histogram bars and whether the RSI can break back above 30 to confirm upside momentum.
Resistance Levels: 70.05, 75.85
Support Levels: 64.65, 60.05

Trade forex, indices, metal, and more at industry-low spreads and lightning-fast execution.
Sign up for a PU Prime Live Account with our hassle-free process.
Effortlessly fund your account with a wide range of channels and accepted currencies.
Access hundreds of instruments under market-leading trading conditions.
Trading Platforms
Learn
About PU Prime
Corporate


Please note the Website is intended for individuals residing in jurisdictions where accessing the Website is permitted by law.
Please note that PU Prime and its affiliated entities are neither established nor operating in your home jurisdiction.
By clicking the "Acknowledge" button, you confirm that you are entering this website solely based on your initiative and not as a result of any specific marketing outreach. You wish to obtain information from this website which is provided on reverse solicitation in accordance with the laws of your home jurisdiction.
Thank You for Your Acknowledgement!
Ten en cuenta que el sitio web está destinado a personas que residen en jurisdicciones donde el acceso al sitio web está permitido por la ley.
Ten en cuenta que PU Prime y sus entidades afiliadas no están establecidas ni operan en tu jurisdicción de origen.
Al hacer clic en el botón "Aceptar", confirmas que estás ingresando a este sitio web por tu propia iniciativa y no como resultado de ningún esfuerzo de marketing específico. Deseas obtener información de este sitio web que se proporciona mediante solicitud inversa de acuerdo con las leyes de tu jurisdicción de origen.
Thank You for Your Acknowledgement!