-
- Trading Platforms
- PU Prime App
- MetaTrader 5
- MetaTrader 4
- PU Copy Trading
- Web Trader
- PU Social
-
- Trading Conditions
- Account Types
- Spreads, Costs & Swaps
- Deposits & Withdrawals
- Fee & Charges
- Trading Hours

ETH, H4:
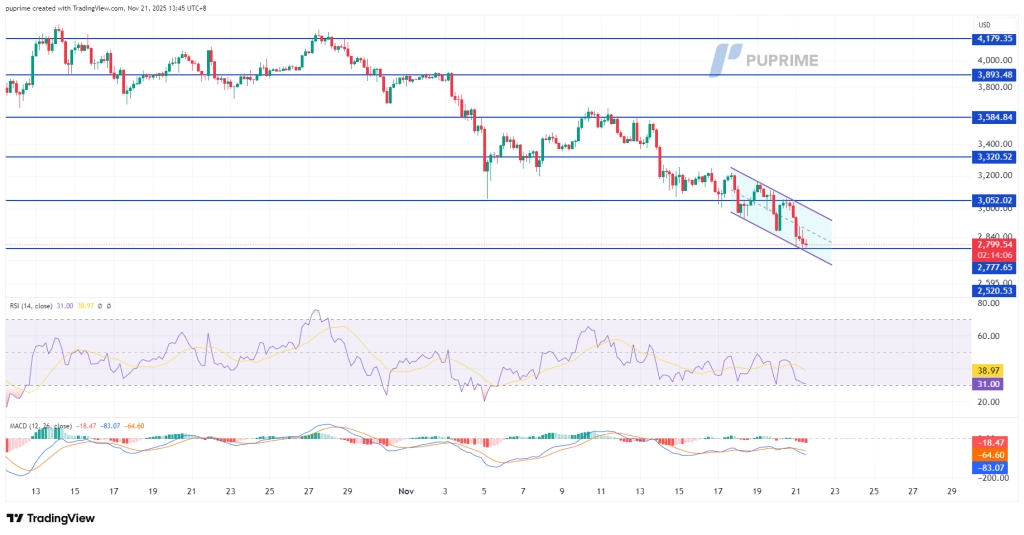
Ethereum remains firmly entrenched within a defined downtrend channel, with selling pressure intensifying as the cryptocurrency breaches the $2,800 psychological level to establish new corrective lows. The prevailing bearish structure suggests continued vulnerability, with the asset now approaching a critical technical juncture at the $2,780 immediate support level.
A decisive break below $2,780 would represent a significant technical deterioration, likely triggering accelerated selling momentum and opening a path toward the next substantial support zone near $2,600. This level now serves as the primary demarcation between continued consolidation within the current channel and a potential bearish acceleration.
Momentum indicators uniformly reflect the prevailing selling pressure. The Relative Strength Index (RSI) remains suppressed below the 50 midline, indicating persistent bearish momentum, while the Moving Average Convergence Divergence (MACD) continues to track flatly beneath its zero line, showing no signs of bullish divergence. This configuration suggests bearish dominance remains intact. For any meaningful recovery to materialize, ETH would need to reclaim the $3,000 level and break above the upper boundary of its descending channel.
Resistance Levels: 3052.00, 3320.50
Support Levels: 2520.00, 2300.00

Dow Jones, H4
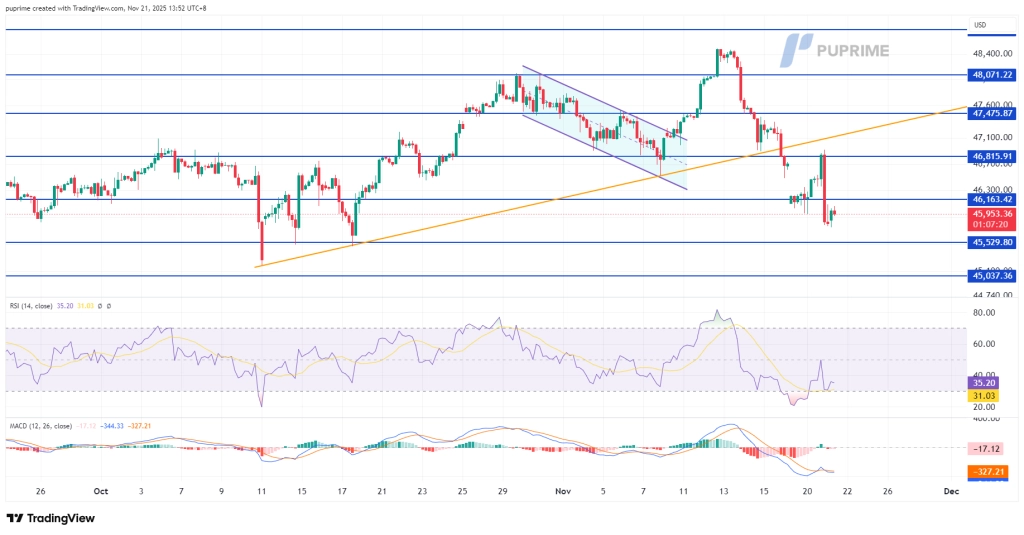
The Dow Jones Industrial Average has sustained a significant technical breakdown, decisively breaching its long-term uptrend support near the 46,900 level. This structural break has triggered a decline of over 2%, effectively erasing all prior recovery gains and establishing a new bearish technical framework.
The failure to maintain footing above this critical support level represents a substantial shift in market dynamics. The index now trades at monthly lows, confirming a deterioration in the broader bullish structure and establishing a negative near-term bias.
Momentum indicators uniformly support the bearish assessment. The Relative Strength Index (RSI) remains depressed near oversold territory, reflecting persistent selling pressure, while the Moving Average Convergence Divergence (MACD) continues its descent below the zero line. This configuration suggests bearish momentum remains firmly intact.
Resistance Levels: 46,165.00, 46,815.00
Support Levels: 45,530.00, 45,040.00

Trade forex, indices, metal, and more at industry-low spreads and lightning-fast execution.
Sign up for a PU Prime Live Account with our hassle-free process.
Effortlessly fund your account with a wide range of channels and accepted currencies.
Access hundreds of instruments under market-leading trading conditions.

Please note the Website is intended for individuals residing in jurisdictions where accessing the Website is permitted by law.
Please note that PU Prime and its affiliated entities are neither established nor operating in your home jurisdiction.
By clicking the "Acknowledge" button, you confirm that you are entering this website solely based on your initiative and not as a result of any specific marketing outreach. You wish to obtain information from this website which is provided on reverse solicitation in accordance with the laws of your home jurisdiction.
Thank You for Your Acknowledgement!
Ten en cuenta que el sitio web está destinado a personas que residen en jurisdicciones donde el acceso al sitio web está permitido por la ley.
Ten en cuenta que PU Prime y sus entidades afiliadas no están establecidas ni operan en tu jurisdicción de origen.
Al hacer clic en el botón "Aceptar", confirmas que estás ingresando a este sitio web por tu propia iniciativa y no como resultado de ningún esfuerzo de marketing específico. Deseas obtener información de este sitio web que se proporciona mediante solicitud inversa de acuerdo con las leyes de tu jurisdicción de origen.
Thank You for Your Acknowledgement!