-
- Trading Platforms
- PU Prime App
- MetaTrader 5
- MetaTrader 4
- PU Copy Trading
- Web Trader
- PU Social
-
- Trading Conditions
- Account Types
- Spreads, Costs & Swaps
- Deposits & Withdrawals
- Fee & Charges
- Trading Hours

Topic Summary:
Want a clearer read on the economy’s direction?
Watch the yield curve. Its historical record is strong at flagging U.S. recessions, and central banks and analysts monitor it, though it is not a perfect predictor and should be used alongside other indicators.
The yield curve maps out how interest rates change over time, from short-term to long-term bonds.
It reflects how investors feel about growth, inflation, and where interest rates could be headed next.
When the curve changes shape, it can be a hint that market expectations are shifting, too.
Knowing how to read the yield curve helps you see what’s driving the market beneath the surface.
It can give you clues about economic strength, recession risks, and how monetary policy might evolve.
By understanding the yield curve, its different shapes, and their significance, traders and investors can anticipate market trends and make more informed decisions.
The yield curve shows how interest rates change over time.
It’s a simple chart with time to maturity on the bottom and bond yields on the side.
Together, those points form a curve that helps traders and investors see what the market expects from the economy.
Most yield curves are based on US Treasury bonds, which are used as a global benchmark.
Because the US government backs Treasuries, they share the same credit quality.
That means the only real difference between each bond’s yield is how long it takes to mature.
To understand the yield curve, it helps to know how bonds work.
Bond prices and yields move in opposite directions.
When investors expect interest rates to rise, they demand higher yields on long-term bonds.
When they expect rates to fall, those yields drop.
Economists call this relationship the term structure of interest rates, but in practice, it’s just a way to show how the market views the future.
When the curve slopes upward, it usually means investors expect healthy growth ahead.
A flat or inverted curve often points to slower growth or uncertainty.
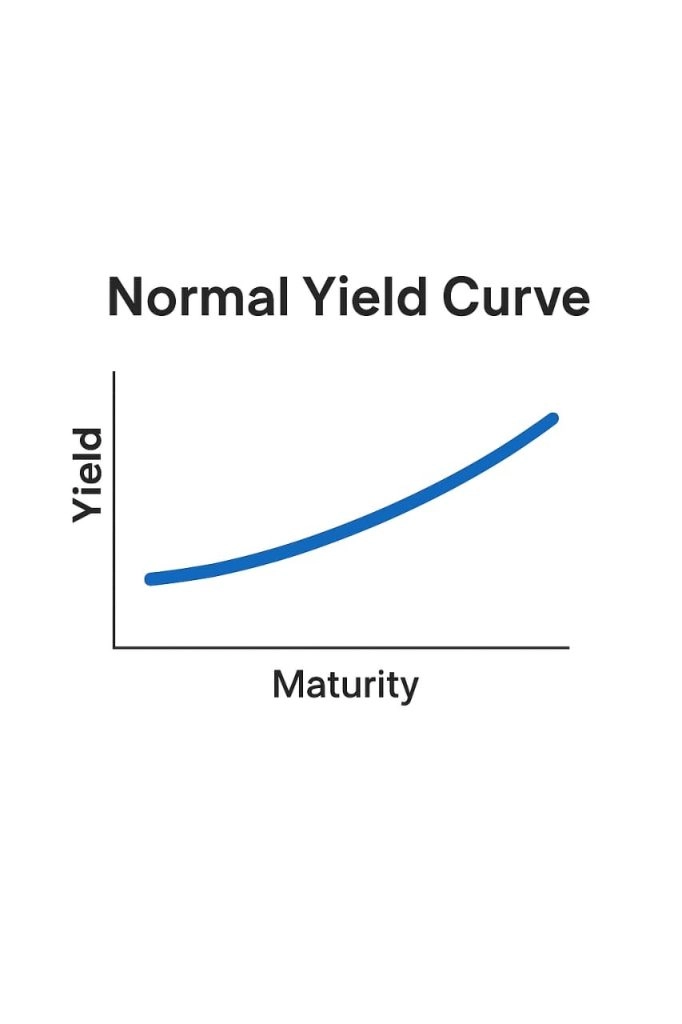
A normal yield curve slopes upwards, with long-term bonds offering higher returns than their short-term equivalent.
This is usually what you see when the economy is ticking along just fine and inflation is under control.
Investors are counting on higher returns in the future to make up for tying up their money for more extended periods.
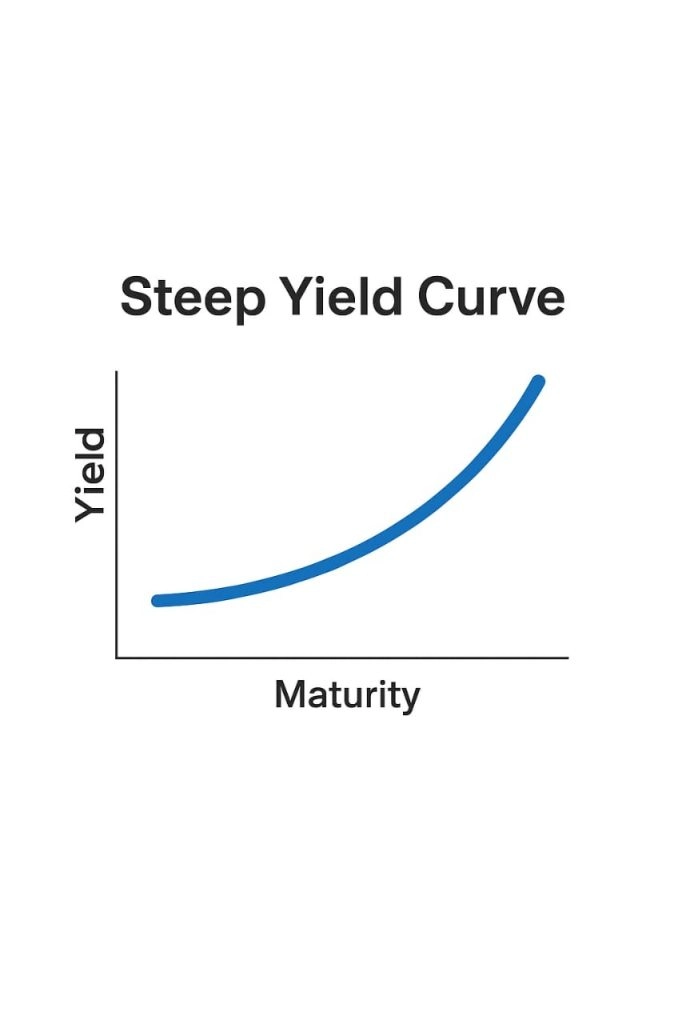
A steep yield curve means long-term rates are rising faster than short-term ones.
Historically, this has come after a period of low rates, when investors expect the economy to pick up, and the central bank raises rates to keep the economy in check.
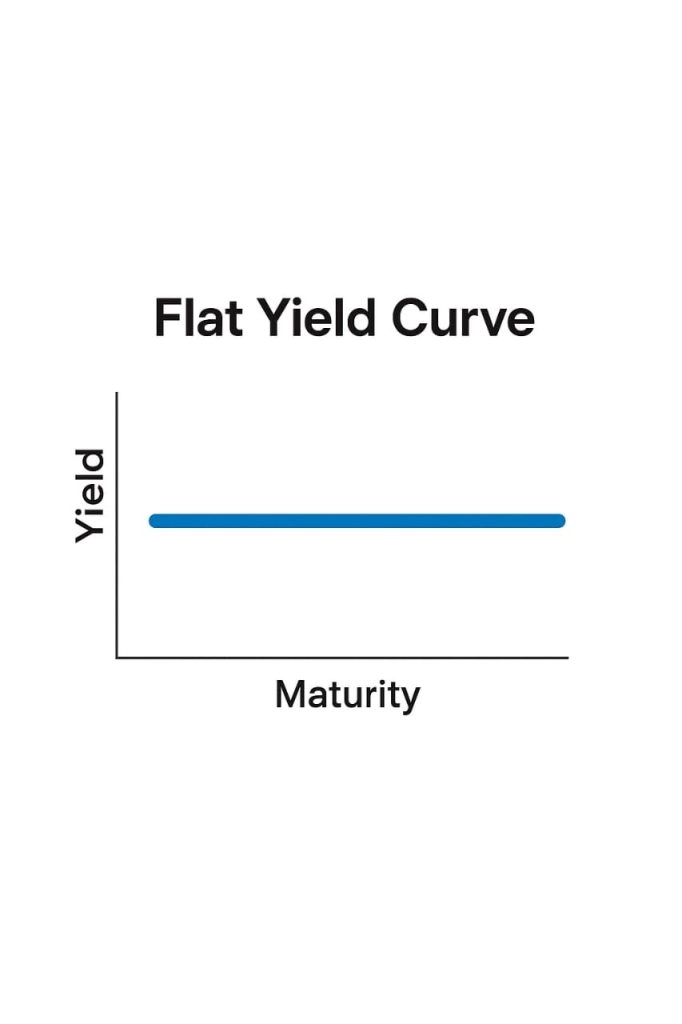
A flat yield curve happens when short-term and long-term yields are practically the same.
It usually signals that markets are unsure which way the economy is heading, suggesting the central bank is nearing the end of a rate-hike cycle.
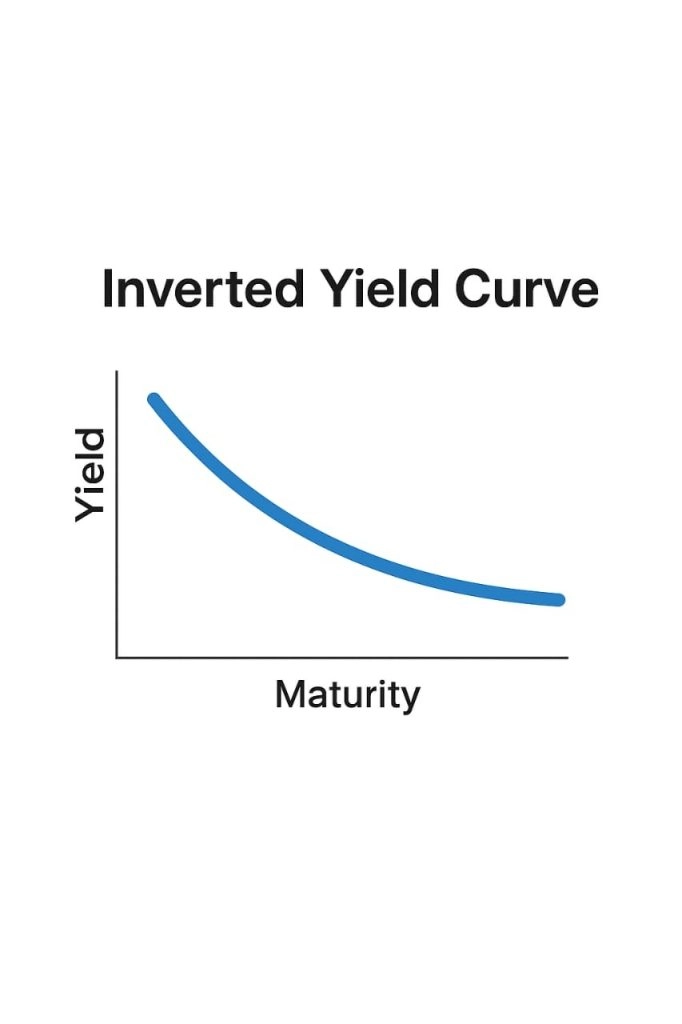
An inverted curve usually forms when investors expect the central bank to cut rates, often because they expect growth to slow.
However, it’s only predicted about half of the US recessions over the past 50 years.
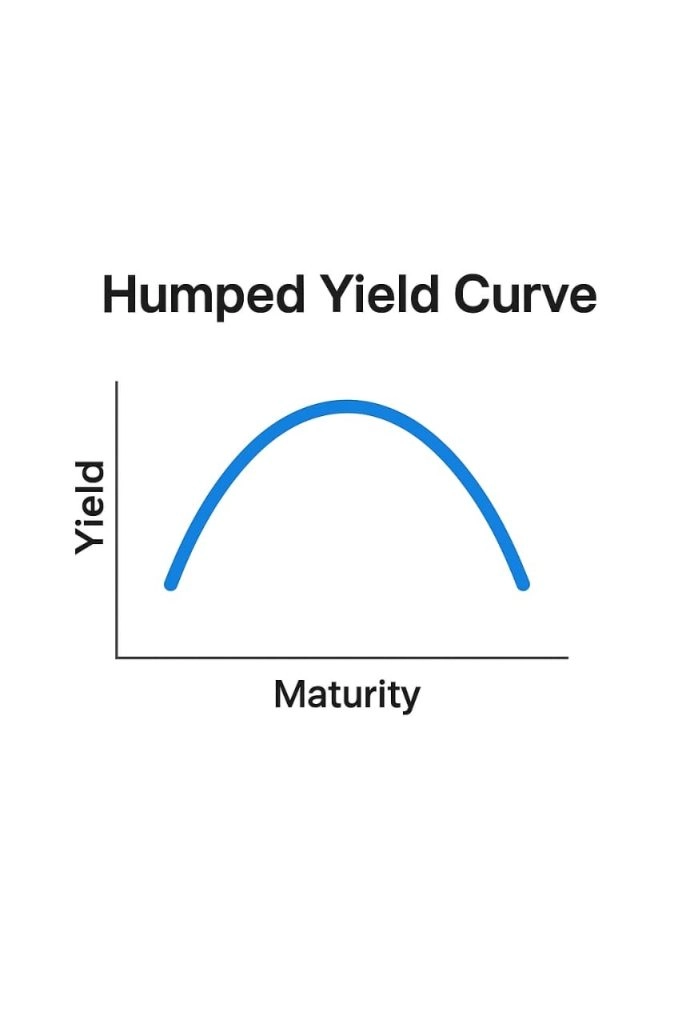
A humped curve – also sometimes called a bell-shaped curve – isn’t seen all that often.
When we do see it, mid-term bonds tend to have higher yields than the short- and long-term ones.
This can happen when markets expect short-term rates to rise, only for them to fall again later as conditions stabilise.
The yield curve shifts as market expectations change, so every shift reflects how investors anticipate future growth, inflation, and interest rates.
The most significant influence on the yield curve is what traders expect the Federal Reserve to do next.
If the market thinks the Fed is planning to raise rates, short-term yields tend to climb; if it believes the Fed is going to cut rates, short-term yields tend to fall.
Long-term bonds are sensitive to inflation because it erodes future returns.
When investors think inflation is going up, they demand higher yields on longer maturities – and conversely, when they think inflation is going down, long-term yields tend to drop, flattening the curve.
Investors tend to prefer keeping their cash in short-term, easily accessible assets.
To get them to commit to locking in more extended periods, markets have to offer a bit more of a return – and that’s why most yield curves slope upwards in regular times.
When investors expect strong growth, yields across the curve tend to rise because demand for capital increases.
When growth slows, demand weakens, and yields decline, often flattening the yield curve.
Traders and investors can examine the shape of the yield curve to gauge where the economy is heading and where interest rates might go.
An inverted yield curve is one of the market’s best warning signs. It has appeared before almost every US recession in the past 50 years.
When short-term yields rise above long-term ones, it means investors expect slower growth and future rate cuts.
But timing is tricky. A curve can invert months or even years before a downturn, so it’s better to view it as an early signal than a precise forecast.
A normal or steep curve appears when the economy is growing.
Investors expect stronger growth, higher inflation and possibly higher interest rates. These shapes mean markets are confident about the future.
Changes in the slope of the curve show shifts in investor sentiment.
A flattening curve means traders are getting cautious; a steepening curve means they’re getting more optimistic.
Watching these shifts helps investors know what the broader market is expecting.
The yield curve also shows how markets view central bank policy.
If short-term yields rise quickly, it suggests traders expect the Federal Reserve to keep raising rates.
If they fall while long-term yields remain low, it can signal expectations of future rate cuts or easing.
Bond investors look at the yield curve to decide how long they want to lock in their money.
When the curve is steep, long-term bonds pay more, and patience is rewarded.
When it’s flat or inverted, short-term bonds make more sense because they carry less risk if rates change.
Some traders look at the difference between two yields (such as the gap between 2-year and 10-year Treasuries) to see whether the curve is likely to flatten or steepen.
Small moves here can tell you a lot about how markets expect growth and inflation to move.
A steep curve lines up with optimism and stronger growth, which can boost banks, construction and energy.
A flat or inverted curve signals slower growth, with steadier sectors like healthcare or utilities holding up better.
Currency traders use yield curves to compare interest rate expectations between countries.
If US yields rise faster than Europe or Japan, investors may buy dollars to get the higher return.
When foreign yields rise, that money can move back out again.
For investors managing a broader portfolio, the curve helps manage risk.
A steep curve means growth ahead, a flattening curve means take a step back.
Watch how it changes over time, and you can adjust before the big moves happen.
The Federal Reserve is the primary force shaping short-term interest rates in the US.
When they raise or lower the federal funds rate, you can expect the short end of the curve to start moving first, and the longer end will follow a bit more slowly.
If the Federal Reserve raises rates to rein in inflation, short-term yields can surge above long-term yields, sometimes leading to an inversion of the yield curve.
When the Federal Reserve starts cutting again, the curve will often steepen as markets start pricing in easier policy and a better growth outlook on the horizon.
Every major data release influences the yield curve.
Substantial job numbers or high inflation tend to push long-term yields higher.
Slower growth or weaker inflation data, on the other hand, will pull them down.
The US yield curve doesn’t exist in a bubble. It influences much of the world’s bond market.
When US yields rise, they often pull global yields higher.
Global politics and trade flows, as well as shifting or changing expectations about growth, can all feed into how the curve looks from day to day.
Banks have a close eye on the slope of the curve because they borrow at short-term rates and lend at long-term ones.
When the curve is steep, lending can be a pretty profitable business, and credit tends to flow freely.
When it flattens out, margins get squeezed and lending tends to slow.
The yield curve has a way of filtering down through to real life in ways most people don’t even notice right away. When it changes, borrowing costs confidence and business decisions change with it.
Long-term bond yields set the tone for borrowing rates—and that includes mortgages.
When yields climb, mortgage rates often follow suit, which can slow housing market activity as buyers hold off a bit longer.
When yields fall, borrowing gets cheaper, and things tend to pick up again (the same goes for car loans, personal loans, and business lending).
Companies often look at the curve before making big business moves.
A steep curve can make long-term borrowing way more expensive, while a flatter curve, where longer-term rates are lower, can encourage significant business decisions.
An inverted curve tends to make headlines, and even if most people don’t trade bonds, they hear the word “recession” and start to get a little nervous.
That nervousness can sometimes lead to less spending and make a slowdown more likely.
Central banks keep a close eye on the yield curve, too —if it starts flattening or inverting, it’s often a sign that policy may be too tight.
That feedback helps shape how the Federal Reserve and others think about changing interest rates in the months ahead.
The yield curve shows how the market views interest rates, inflation, and growth.
It’s not perfect at predicting what’s next, but it’s one of the clearest ways to see where investor expectations are heading.
If you want to follow those moves as they happen, PU Prime gives you access to real-time data, research, and simple tools that make the yield curve easier to understand.
With the right information, you can connect what’s happening on the curve to what’s happening in the market.
Ready to put yield curve insights into action? Open a free demo account on PU Prime to access real-time data and practice strategies before trading live.
Can the yield curve 100% accurately predict a recession?
No. It’s a strong signal but not a promise. Sometimes it inverts without a downturn. It’s better to see it as one part of the bigger economic picture.
Does the yield curve ever get it wrong?
Yes, it can. Sometimes the curve flattens or inverts for short-term reasons (such as a sudden change in market sentiment or central bank policy), even when the economy keeps ticking along.
How often does the yield curve change?
Pretty much every day. It moves as new information comes out, and even small changes in outlook can shift its shape.
Why do people always talk about the 2-year and 10-year yields?
Those two points are the market’s favorite comparison.
The gap between them gives a quick read on how confident investors feel about the future.
When the difference shrinks or reverses, it often signals that expectations about growth or interest rates are changing.
Do different countries have their own yield curves?
Each country’s curve reflects its own economy and policies.
Australia, Japan, and the UK all have versions that show how local investors expect their interest rates to move over time.
What happens when the curve goes back to normal?
If the curve steepens again after an inversion, it may signal that the market expects growth to pick up or that the central bank is easing policy.
Sometimes that shift comes before a recovery, and sometimes it happens once the slowdown is already underway.
Step into the world of trading with confidence today. Open a free PU Prime live CFD trading account now to experience real-time market action, or refine your strategies risk-free with our demo account.
This content is for educational and informational purposes only and should not be considered investment advice, a personal recommendation, or an offer to buy or sell any financial instruments.
This material has been prepared without considering any individual investment objectives, financial situations. Any references to past performance of a financial instrument, index, or investment product are not indicative of future results.
PU Prime makes no representation as to the accuracy or completeness of this content and accepts no liability for any loss or damage arising from reliance on the information provided. Trading involves risk, and you should carefully consider your investment objectives and risk tolerance before making any trading decisions. Never invest more than you can afford to lose.

Trade forex, indices, metal, and more at industry-low spreads and lightning-fast execution.
Sign up for a PU Prime Live Account with our hassle-free process.
Effortlessly fund your account with a wide range of channels and accepted currencies.
Access hundreds of instruments under market-leading trading conditions.

Please note the Website is intended for individuals residing in jurisdictions where accessing the Website is permitted by law.
Please note that PU Prime and its affiliated entities are neither established nor operating in your home jurisdiction.
By clicking the "Acknowledge" button, you confirm that you are entering this website solely based on your initiative and not as a result of any specific marketing outreach. You wish to obtain information from this website which is provided on reverse solicitation in accordance with the laws of your home jurisdiction.
Thank You for Your Acknowledgement!
Ten en cuenta que el sitio web está destinado a personas que residen en jurisdicciones donde el acceso al sitio web está permitido por la ley.
Ten en cuenta que PU Prime y sus entidades afiliadas no están establecidas ni operan en tu jurisdicción de origen.
Al hacer clic en el botón "Aceptar", confirmas que estás ingresando a este sitio web por tu propia iniciativa y no como resultado de ningún esfuerzo de marketing específico. Deseas obtener información de este sitio web que se proporciona mediante solicitud inversa de acuerdo con las leyes de tu jurisdicción de origen.
Thank You for Your Acknowledgement!