PU Prime App
Exclusive deals on mobile


PU Prime App
Exclusive deals on mobile
Hold The Global Markets In Your Hands
Our trading mobile app is compatible with most smart devices. Download the App now and start trading with PU Prime on any device, anytime and anywhere.


9 October 2023,05:16
Daily Market Analysis
9 October 2023, 05:16


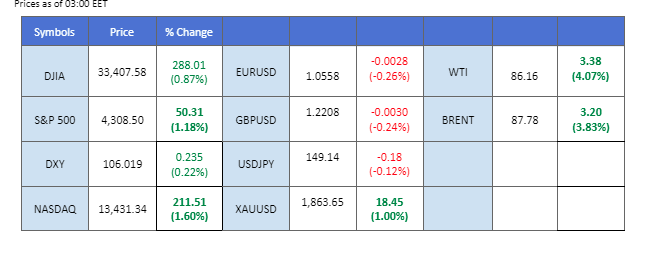
The week kicked off with a surge in gold prices, climbing nearly 1%, driven by the escalating conflict in the Middle East involving Israel and Palestinian militant group, Hamas. Simultaneously, oil prices recovered, jumping more than 4% after a significant weekly drop. Rattled by geopolitical tensions, investors sought refuge in precious metals and commodities. The dollar has responded positively to the war as traders seek safe haven currency. The dollar initially found strength from a positive Nonfarm Payroll report, a high unemployment rate and lacklustre average hourly earnings data curbed gains. In addition, the war outbreak in the Middle East cast a shadow over equity markets, grappling with bearish sentiment yet still finding some support.
Current rate hike bets on 1st November Fed interest rate decision:
Source: CME Fedwatch Tool
0 bps (72.0%) VS 25 bps (28%)

The US Dollar experienced significant volatilities while retreated from crucial resistance level amid mixed economic data. The US Bureau of Labor Statistics reported disappointing figures for Average Hourly Earnings (0.20%) and the Unemployment Rate (3.80%), both falling short of market expectations. However, the silver lining came in the form of Nonfarm Payrolls, which exceeded projections with a robust figure of 336K, far surpassing the anticipated 170K. Nonetheless, rising geopolitical tensions due to the Israel-Hamas conflict had sparked demand for a safe-haven dollar.
The Dollar Index is trading lower following the prior retracement from the resistance level. MACD has illustrated increasing bearish momentum, while RSI is at 58, suggesting the index might extend its losses toward support level since the RSI retreated sharply from overbought territory.
Resistance level: 106.95, 108.65
Support level: 105.25, 103.15
Hamas and Islamic Jihad’s sudden and aggressive offensive against Israel has reverberated through global geopolitics, amplifying uncertainty and compelling investors to seek refuge in safe-haven assets, notably gold and the US dollar. The rapid escalation of violence has introduced a heightened layer of geopolitical risk, prompting a cautious approach in financial markets.
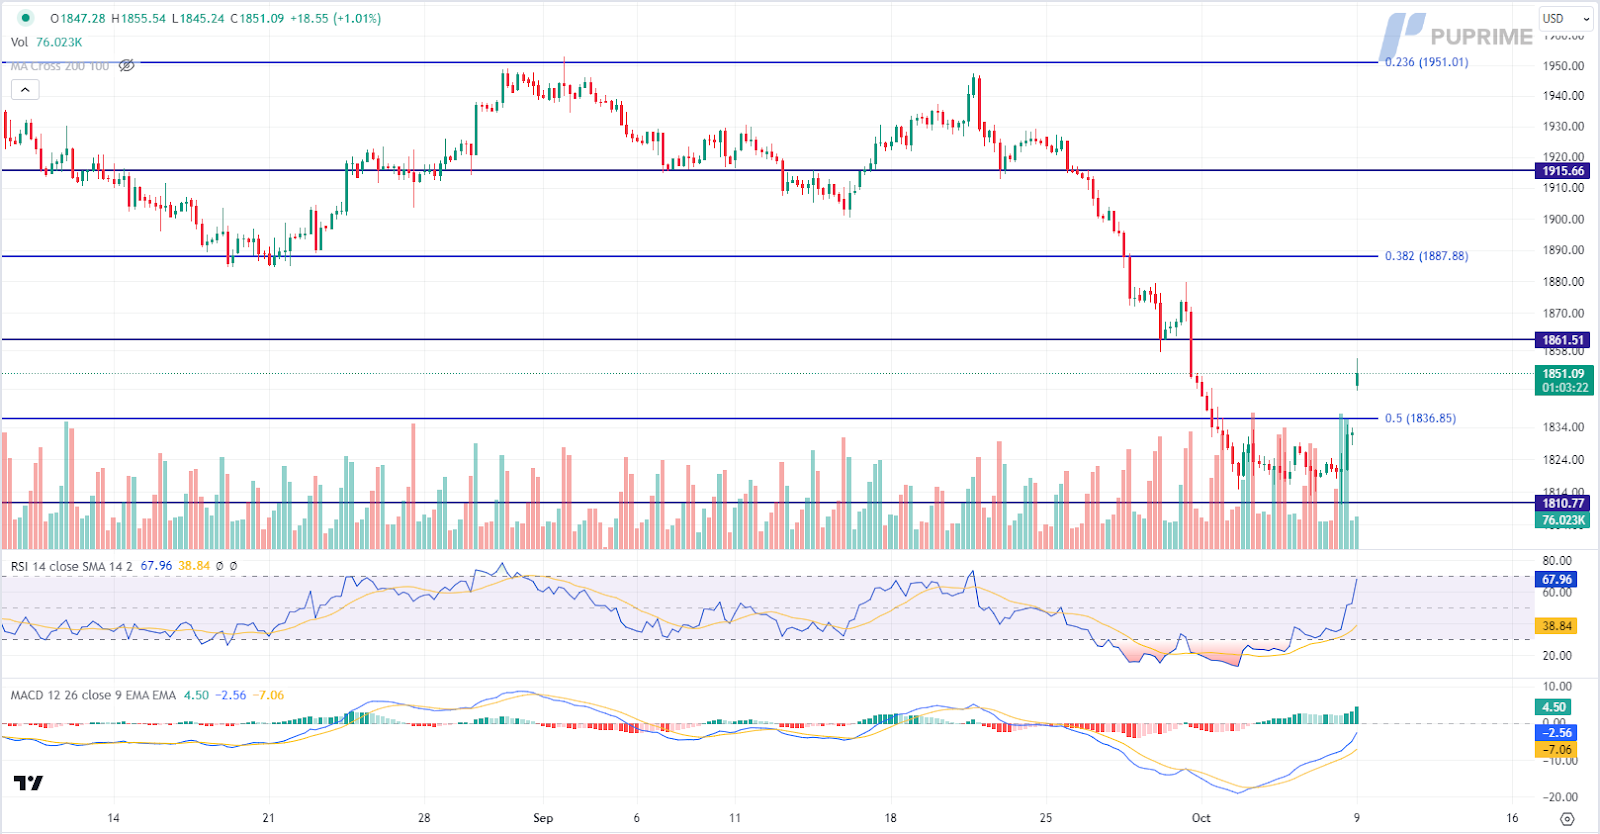
Gold prices are trading higher following the prior breakout above the previous resistance level. MACD has illustrated increasing bullish momentum, while RSI is at 68, suggesting the commodity might extend its gains since the RSI stays above the midline.
Resistance level: 1860.00, 1890.00
Support level: 1835.00, 1810.00
The euro’s trend reversal gained substantial ground after last Friday’s lacklustre U.S. economic data, failing to ignite a sustained dollar rally. Initially lifted by an encouraging Nonfarm Payroll report, which surpassed both forecast and previous figures, the dollar later faltered. The downturn came as the unemployment rate revealed signs of labour market slackening, and average hourly earnings growth took a hit. The disappointing U.S. data provided solid footing for the euro’s resurgence, highlighting the delicate balance in the global currency markets amidst shifting economic landscapes.
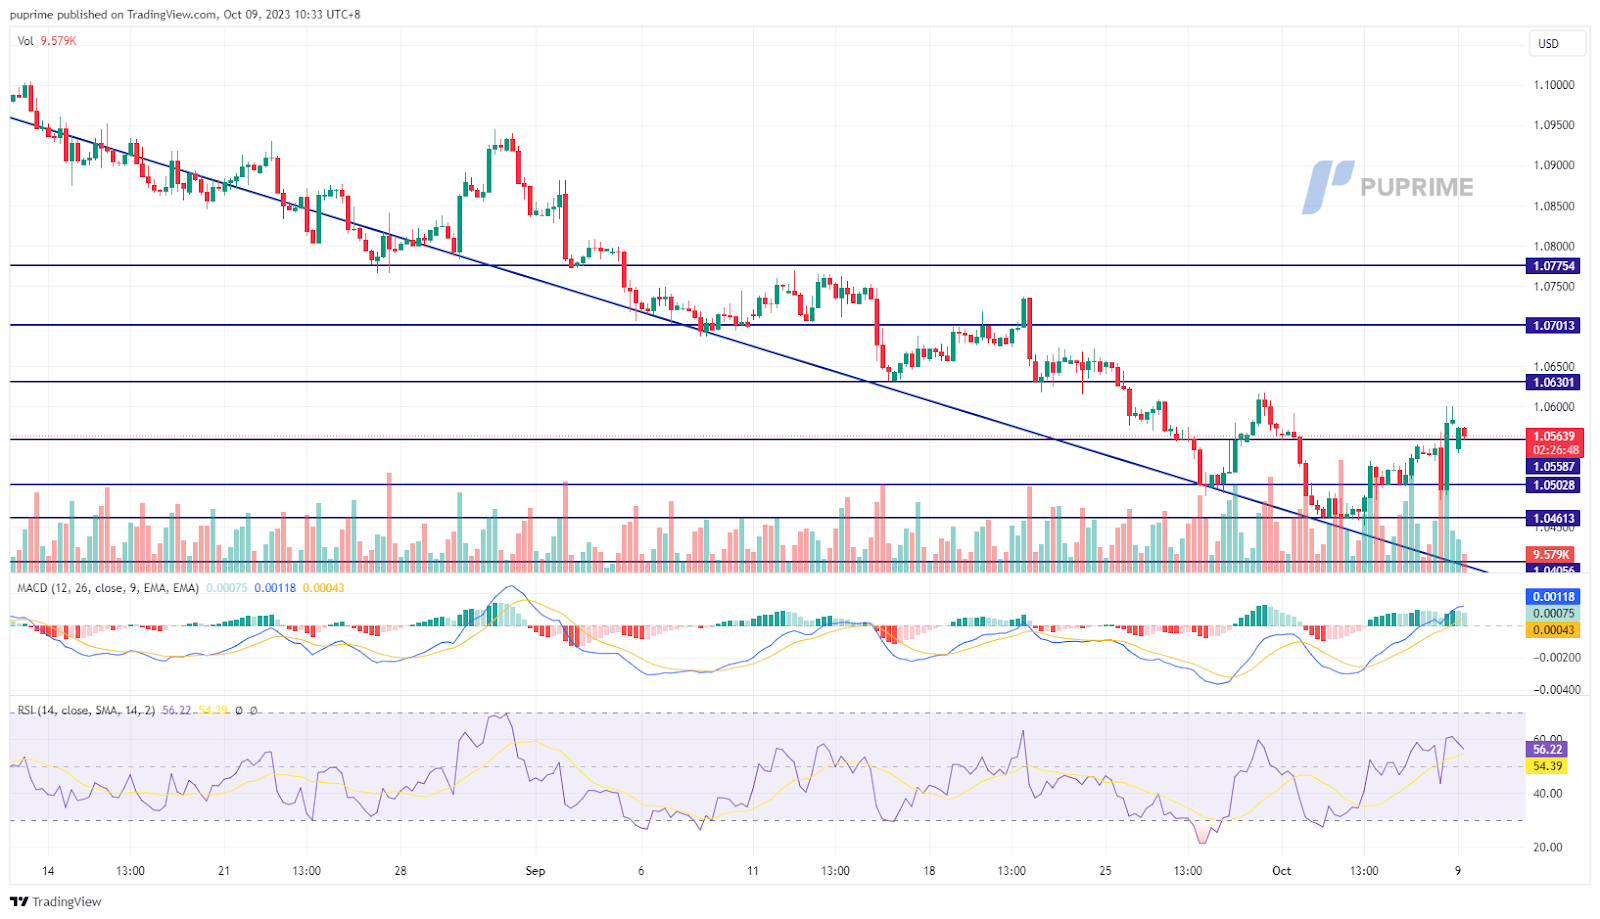
The EUR/USD pair is approaching its psychological resistance level at 1.0600 level, while the MACD has strongly broken above the zero line and the RSI has been rising, suggesting the trend reversal signal is solid.
Resistance level: 1.0630, 1.0700
Support level: 1.0500, 1.0460

The USD/JPY pair displayed notable resilience, despite reaching around 149. The diminishing risk appetite prevailing in the global financial market prompted investors to seek refuge in the safe-haven Japanese yen. This flight to safety underscores the significance of geopolitical tensions in reshaping currency dynamics. Looking ahead, investors will maintain a keen focus on these tensions, as well as upcoming US inflation data. These factors will serve as critical determinants in shaping the trajectory of the USD/JPY pair, impacting both forex markets and broader investment strategies.
USD/JPY is trading higher following the prior rebound from the support level. However, MACD has illustrated diminishing bullish momentum, while RSI is at 51, suggesting the pair might experience technical correction since the RSI retreated sharply from overbought territory.
Resistance level: 149.95, 151.45
Support level: 148.40, 147.50

The US equity market faced headwinds on Monday as the deepening military conflict in the Middle East cast a shadow over global risk appetite. Investors, quick to recalibrate their portfolios, began moving away from the high-risk equity market amid heightened geopolitical tensions. This retreat highlighted the growing unease among market participants and served as a stark reminder of the fragility of financial markets in times of geopolitical turmoil. As the situation unfolds, investors remain vigilant, assessing the potential impact on their investments and risk management strategies.
The Dow is trading lower following the prior retracement from the resistance level. However, MACD has illustrated increasing bullish momentum, while RSI is at 44, suggesting the index might experience technical correction since the RSI rebounded sharply from oversold territory.
Resistance level: 33425.00, 34355.00
Support level: 32745.00, 32015.00

The British Pound extended its rally against a weakening dollar, confidently striding beyond its long-term downtrend channel. Last Friday’s economic data contributed to the dollar’s stumble, indicating labour market easing and denting its previous bullish momentum. However, the recent surge in geopolitical tensions in the Middle East is anticipated to bolster the safe-haven appeal of the dollar, suggesting potential volatility ahead in the currency markets. Investors brace for a fluctuating landscape as economic indicators and geopolitical events continue to shape global currencies.
The Cable is trading firmly above its long-term downtrend channel suggesting a solid trend reversal signal for the Cable. The RSI is flowing above the 50-level while the MACD has strongly broken above the zero line suggesting the bullish momentum is forming.
Resistance level: 1.2370 , 1.2530
Support level: 1.2040, 1.1940
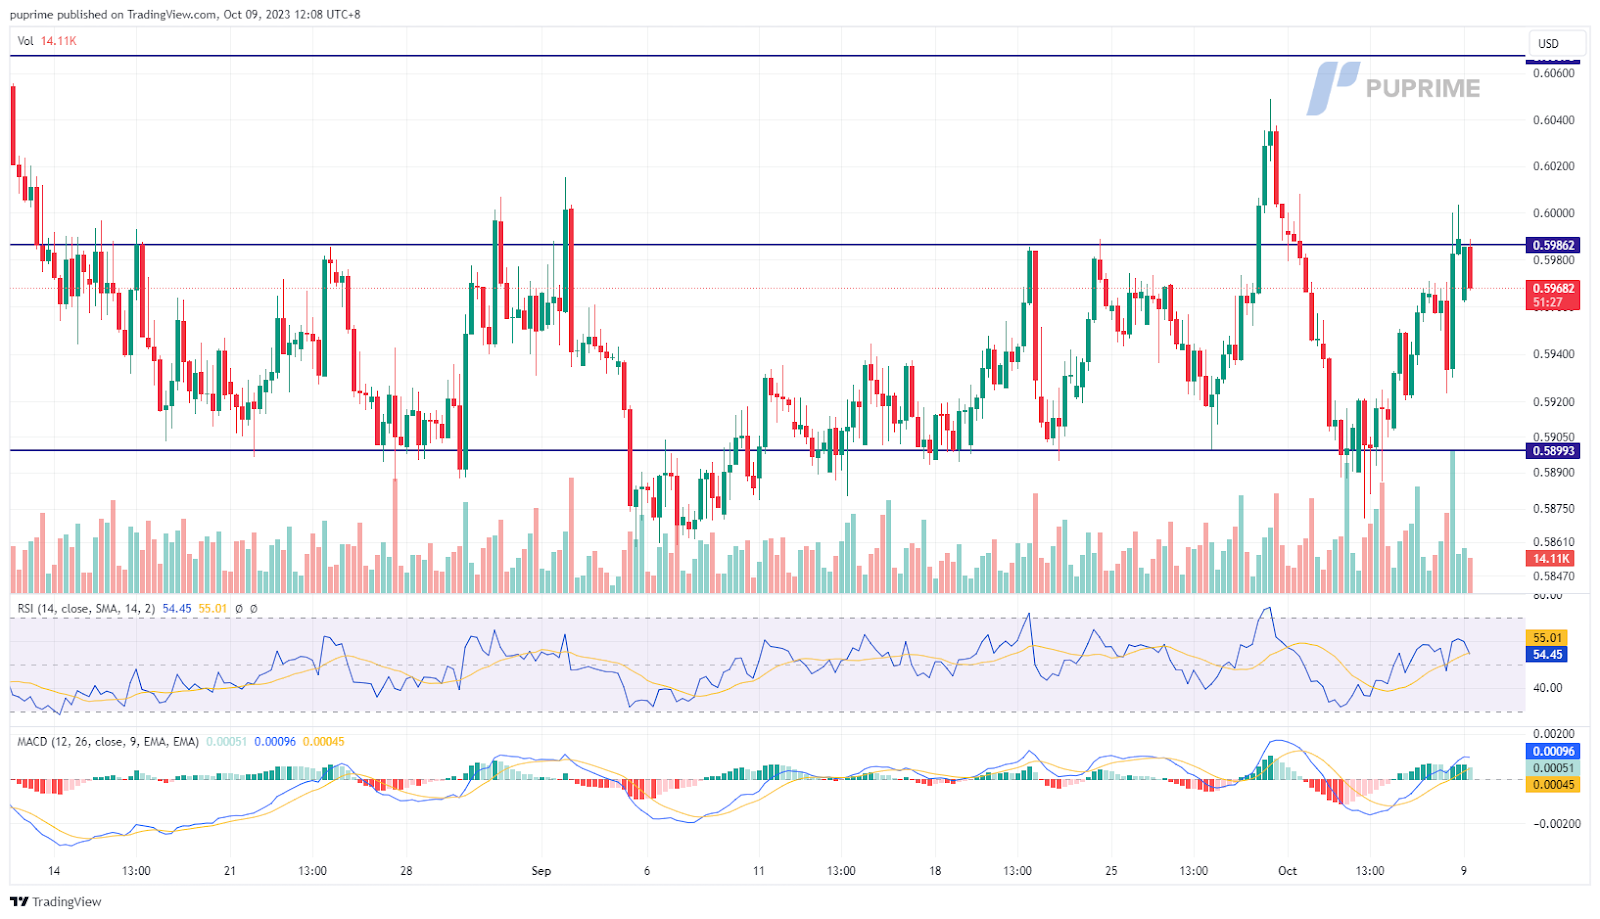
The New Zealand Dollar’s promising trend reversal faced headwinds around the crucial 0.5900 support level, hampered by geopolitical tensions stemming from the latest Middle East conflict. Opting for safety, traders gravitated towards the dollar, impacting the Kiwi’s bullish momentum. Uncertainty looms over the Federal Reserve’s rate hike trajectory, compounded by mixed signals from Friday’s labour market data. Investors brace for potential volatility in the coming days as global factors continue to shape currency market trends.
The NZD/USD pair showed a promising trend reversal after rebounding strongly from its support level at 0.5900. The RSI has been moving uptrend and is approaching the overbought zone while the MACD has strongly broken above the zero line, suggesting a bullish momentum is forming.
Resistance level: 0.6070, 0.6130
Support level: 0.5900, 0.5800
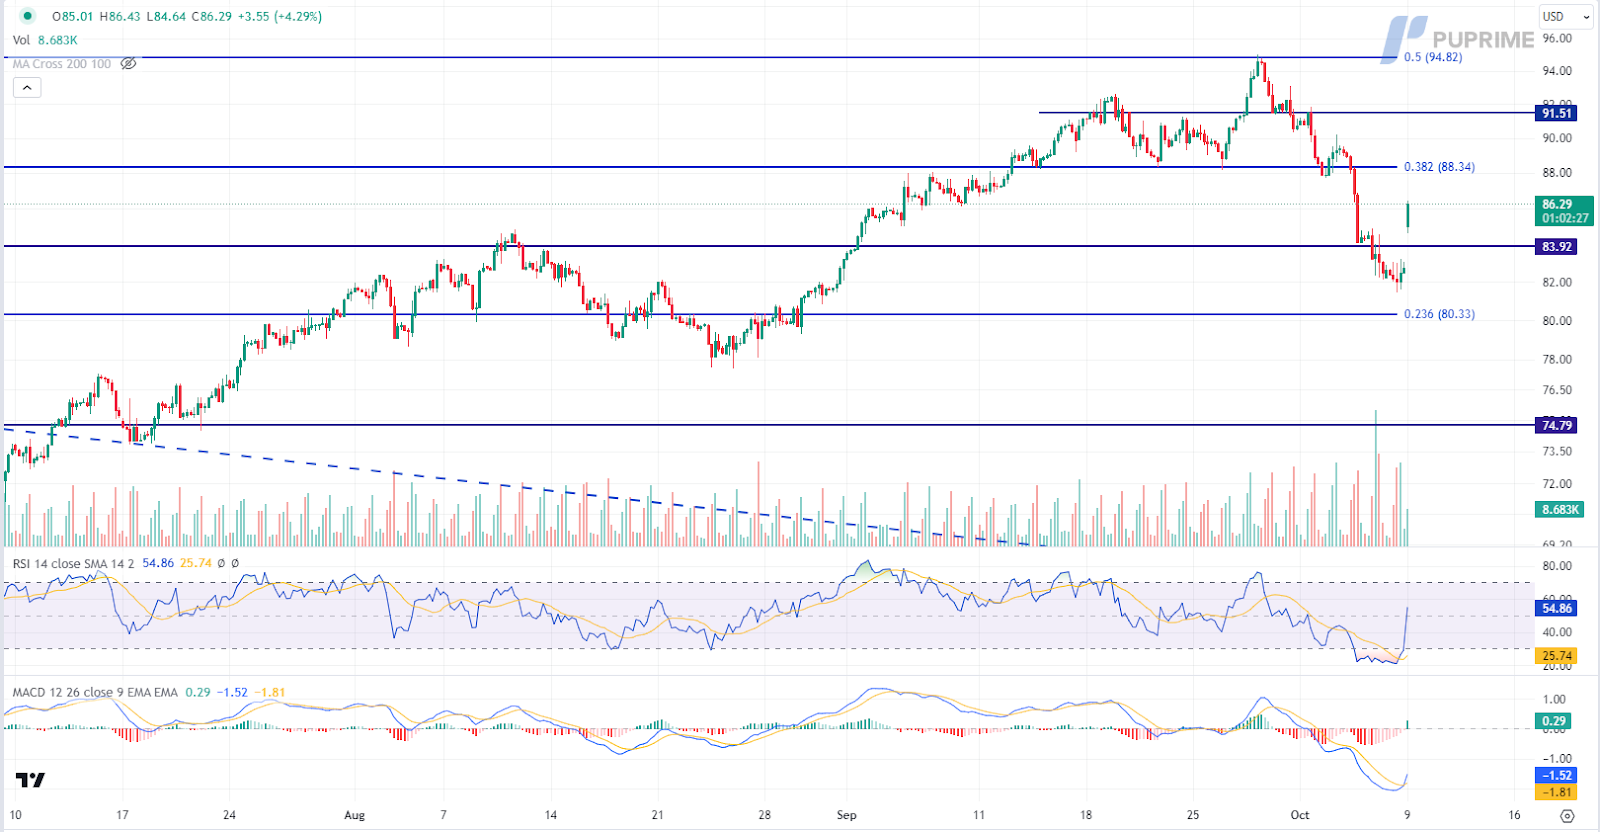
In the wake of the Israel-Hamas conflict, oil markets experienced a sharp and aggressive surge. Fearful of an escalation, traders responded swiftly, causing significant fluctuations in oil prices. The situation, still contained within the Middle East, has raised concerns about a potential proxy war involving major powers, particularly the United States and Iran. Analysts are closely monitoring any evidence linking Iran to the attack, which could lead to renewed crackdowns on Iranian oil exports, further complicating global energy dynamics.
Oil prices are trading higher following the prior breakout above the previous resistance level. MACD has illustrated increasing bullish momentum, while RSI is at 55, suggesting the commodity might extend its gains toward resistance level since the RSI stays above the midline.
Resistance level: 88.35, 91.50
Support level: 83.90, 80.35

Trade forex, indices, metal, and more at industry-low spreads and lightning-fast execution.
Sign up for a PU Prime Live Account with our hassle-free process.
Effortlessly fund your account with a wide range of channels and accepted currencies.
Access hundreds of instruments under market-leading trading conditions.
Trading Platforms
Company
FAQs
PU Prime App - Start Trading with an Edge


Risk Warning: Trading Contract for Difference (CFD) carries a high level of risk to your capital and may result in losses that exceed your deposits due to leverage. It's important to understand how CFDs work and assess whether you can afford the high risk of losing your money. When acquiring our derivative products, you do not own or have rights in the underlying assets. Past performance is not indicative of future results. The information on this website is general and does not take into account your personal objectives, financial circumstances, or needs. Seek independent advice from qualified experts if necessary, and ensure you fully understand the risks before making any trading decisions.
PU Prime Ltd, is authorized and regulated by the Financial Services Authority of Seychelles under License No. SD050, with registered address CT House, Office 9A, Providence, Mahe, Seychelles.
Finzero Cap Ltd, registered in the Republic of Cyprus with registration number HE414308 and registered address at 62 Athalassas, Mezzanine, Strovolos, 2012, Nicosia, Cyprus.
Finzero Cap Ltd facilitates services to the licensed and regulated entities within the PuPrime Organizational structure, including but not limited to payment services.
The information on this website is not intended for residents of certain jurisdictions, including the United States, Singapore, Australia, China and jurisdictions listed on the FATF and EU/UN sanctions lists. It is not intended for distribution or use where such distribution or use would be contrary to local law or regulation. While the Authority has granted a securities or derivatives investment business licence to the Licensee, it does not endorse the products offered.
Copyright © 2024 PU Prime.

Please note the Website is intended for individuals residing in jurisdictions where accessing the Website is permitted by law.
Please note that PU Prime and its affiliated entities are neither established nor operating in your home jurisdiction.
By clicking the "Acknowledge" button, you confirm that you are entering this website solely based on your initiative and not as a result of any specific marketing outreach. You wish to obtain information from this website which is provided on reverse solicitation in accordance with the laws of your home jurisdiction.
Thank You for Your Acknowledgement!
Ten en cuenta que el sitio web está destinado a personas que residen en jurisdicciones donde el acceso al sitio web está permitido por la ley.
Ten en cuenta que PU Prime y sus entidades afiliadas no están establecidas ni operan en tu jurisdicción de origen.
Al hacer clic en el botón "Aceptar", confirmas que estás ingresando a este sitio web por tu propia iniciativa y no como resultado de ningún esfuerzo de marketing específico. Deseas obtener información de este sitio web que se proporciona mediante solicitud inversa de acuerdo con las leyes de tu jurisdicción de origen.
Thank You for Your Acknowledgement!
